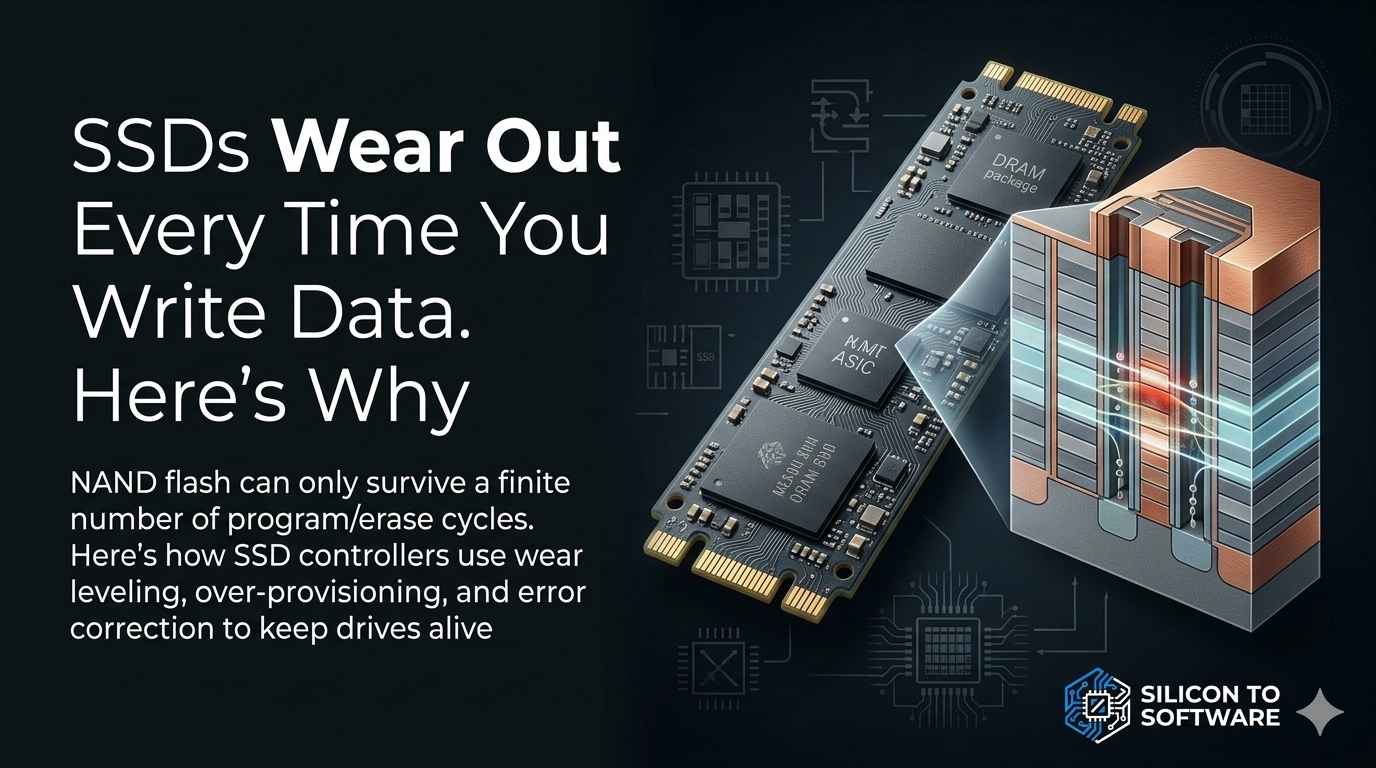
SSDs Wear Out Every Time You Write Data. Here’s Why
NAND flash can only survive a finite number of program/erase cycles. Here’s how SSD controllers use wear leveling, over-provisioning, and error correction to keep drives alive.
Hard drives taught us what storage failure looks like: a head touching a platter, a spindle bearing starting to whine. When storage lost its moving parts, most people reasonably concluded there was nothing left to wear out.
That conclusion is wrong. Every program and erase operation drives charge through a thin insulating layer inside the NAND flash cell, and the damage accumulates. Your writes don’t map one-to-one onto those operations, because the controller buffers, reorganizes, and relocates data along the way, but every write eventually becomes NAND activity. Your SSD has been counting and managing that damage since the first file you saved.
So the real question about SSD lifespan is this: if the cells are degrading from day one, why does your drive still work fine years later?
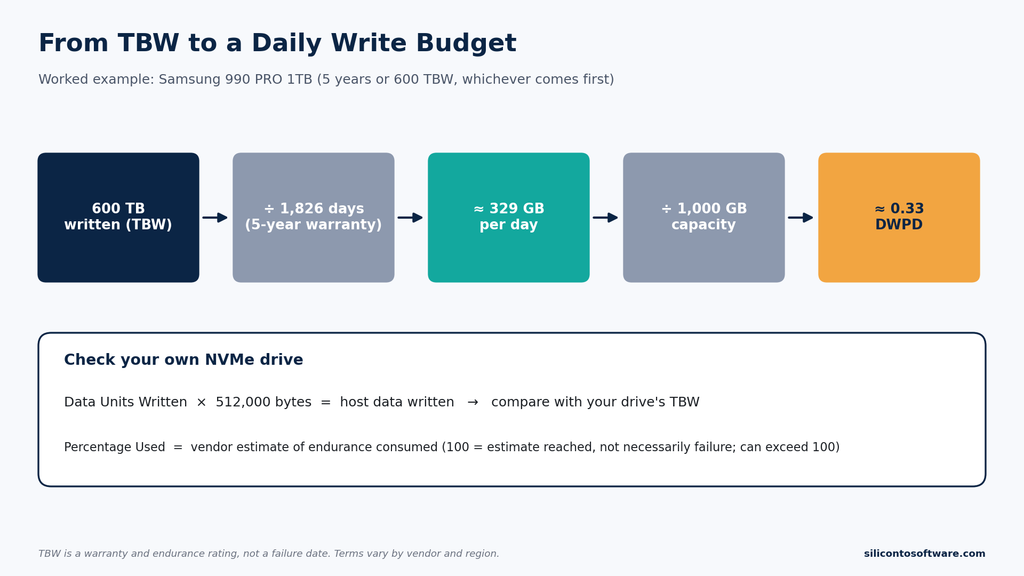
Because the damage is budgeted, and the budget is large. Samsung rates and warranties the 990 PRO 1TB, a widely sold PCIe 4.0 drive, for five years or 600 TB written, whichever comes first. That works out to roughly 330 GB of writes every day for five years. For many ordinary client workloads, writing 330 GB every day would be unusually high, although good public field data on consumer write volumes is limited. Later in this article I’ll show you how to check your own drive rather than take my word for it.
This article follows the wear from the cell outward: what physically degrades inside NAND flash, why TLC and QLC trade endurance for density, how write amplification multiplies wear, how the controller fights back, and what TBW and DWPD ratings actually promise.
Key takeaways
- Every host write eventually turns into NAND program and erase activity, and that activity physically wears the flash. SSD lifespan depends on how well the controller manages that wear, not on avoiding it.
- More bits per cell means tighter voltage margins and lower endurance, which controllers offset with stronger error correction and wear management.
- Write amplification can multiply wear far beyond what the host writes. In large-scale enterprise field data, controller and firmware behavior drove wide variation.
- TBW is a warranty boundary for write endurance, not a failure date. Wear is one factor in SSD lifespan, and not always the dominant one.
- Retention (data loss while unpowered) is a separate mechanism from write wear, though the two meet in the endurance spec.
Table of Contents
Why NAND Flash Wears Out: What Happens Inside the Cell
A NAND flash cell is a transistor with a charge-storage layer between the control gate and the channel. Stored charge shifts the transistor’s threshold voltage (Vt), and the controller reads data by sensing which Vt range the cell falls into. Programming and erasing both move charge through a tunnel dielectric under high electric fields.
That stress is the wear mechanism. Carnegie Mellon researchers measured that as P/E cycles accumulate, each state’s threshold voltage distribution shifts right and widens. They attribute this to tunnel oxide degradation: damaged oxide lets electrons through more easily, so if programming conditions stay the same, each operation injects more charge than before. As the distributions widen, they start to overlap their neighbors, producing raw bit errors. That work was done on planar NAND, but the underlying mechanism of oxide wear applies across architectures.
P/E cycling isn’t the only source of cell-level errors, either. Read disturb, program interference, and retention loss also shift threshold-voltage distributions, and Google’s field study found read disturb significant enough to affect raw error rates in some drive models. That’s why drive reliability can’t be predicted from cycle count alone.
That overlap is the whole story in miniature. Everything else in this article is either a factor that makes it worse or a technique for living with it.
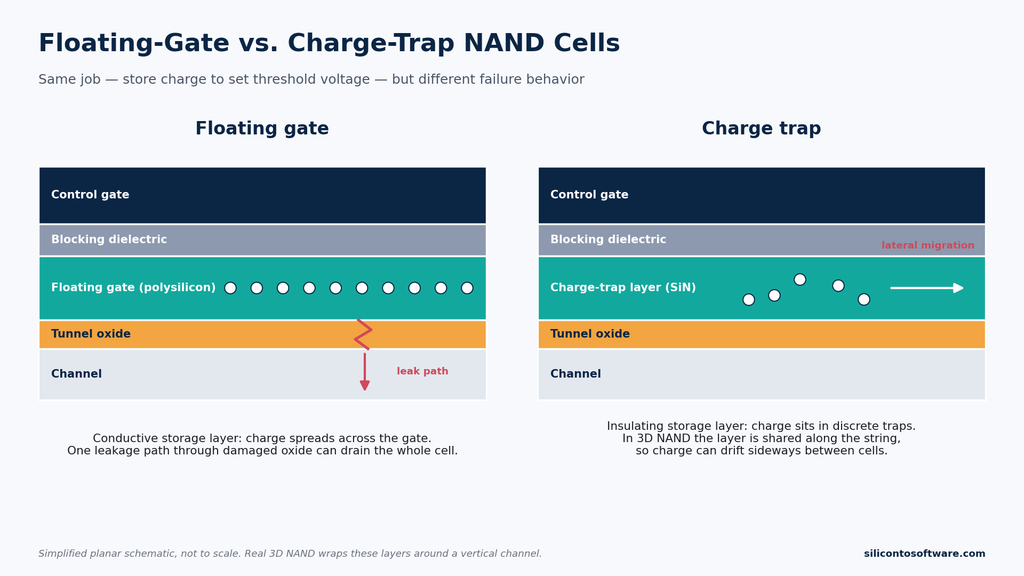
Floating-gate vs. charge-trap cells
Classic floating-gate cells store charge on a conductive polysilicon gate surrounded by oxide, moved in and out by Fowler-Nordheim tunneling. Because the gate is a conductor, stored charge spreads across it, and a single leakage path through damaged oxide can drain the entire cell.
Charge-trap designs, which store charge in an insulating layer instead, are widely used in current 3D NAND. Micron is a documented example of the transition, having moved its cell technology from floating gate to charge-trap. One notable exception is Solidigm, which builds its D5 Series QLC drives on floating-gate technology.
The architecture changes the failure profile in both directions. According to the Carnegie Mellon survey, charge-trap tunneling oxide is less prone to breakdown under high-voltage operation, which helps endurance. But the storage layer is shared along the vertical string, and early research on a stacked 3D NAND test structure traced fast charge loss mainly to lateral charge migration through those shared layers, a mechanism later studies continue to examine. Peer-reviewed work separates long-term charge loss in charge-trap 3D NAND into three distinct mechanisms: detrapping, trap-assisted tunneling, and lateral migration.
The practical consequence for anyone evaluating drives: an explanation built only on floating-gate physics misses the charge-trap architecture widely used in modern 3D NAND.
Program/Erase Cycles: The Finite Budget Behind SSD Endurance
NAND can’t overwrite in place. According to JEDEC’s own presentation of its SSD endurance standard, a program/erase cycle is the writing of one or more pages in an erase block and the erasure of that block, so wear accrues per block.
The P/E rating attached to that block is a qualified number, not a physical constant. Virtium describes a NAND P/E rating as dependent on the controller’s error correction capability, an assumed temperature, and an assumed retention requirement. Change the assumptions and the same silicon earns a different number.
That’s why published figures vary so widely, and why consumer ratings are rarely published at all:
- A regulatory filing: Tesla told NHTSA the Hynix eMMC in older Model S and X displays was rated for 3,000 P/E cycles.
- Google’s field study: the MLC drives in its fleet were rated for 3,000 cycles, SLC for 100,000, and eMLC for 10,000.
- A current enterprise QLC drive: Solidigm rates its D5-P5430 at 3,000 cycles.
A QLC drive carrying the same rating as older MLC parts is a reminder that the number reflects qualification conditions and controller design, not bits per cell alone.
SLC vs. MLC vs. TLC vs. QLC: How Bits per Cell Affect SSD Lifespan
The endurance hierarchy follows from how many Vt states each cell must hold:
| Cell type | Bits per cell | Vt states |
|---|---|---|
| SLC | 1 | 2 |
| MLC | 2 | 4 |
| TLC | 3 | 8 |
| QLC | 4 | 16 |
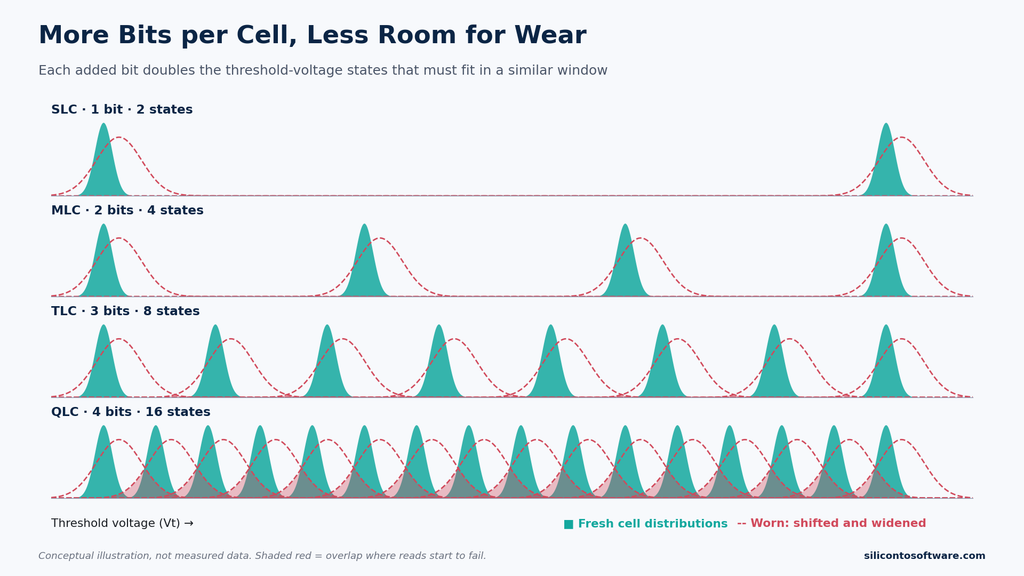
Each added bit doubles the number of states that must fit in a similar voltage window, so the spacing between them shrinks with every step. The same amount of wear-induced widening that SLC shrugs off causes overlap in QLC.
The industry chose this trade deliberately: lower cost per bit, smaller voltage margins. The Carnegie Mellon survey frames it the same way. Scaling and multi-level coding left fewer electrons representing each value, and more interference between cells, and SSD controllers grew far more sophisticated to compensate.
QLC is therefore not a defective technology. It’s density-optimized: its lower native endurance margin makes it a natural fit for read-heavy and moderate-write workloads, while sustained write-intensive applications need careful drive-level endurance qualification.
Cell type isn’t the final word on reliability, either. Google’s six-year field study found no evidence that its higher-end SLC drives were more reliable than MLC within typical drive lifetimes. SLC’s raw bit error rates were orders of magnitude lower, but those drives didn’t have lower repair or replacement rates, and didn’t typically have lower rates of user-visible errors. The cell sets the raw material. The system determines what the user experiences.
Write Amplification: Why the NAND Sees More Writes Than You Do
JEDEC’s presentation of the standard defines write amplification factor (WAF) as data written to NAND divided by data written by the host. It exists because pages are programmed individually while erases happen a whole block at a time.
JEDEC’s worked example shows the worst case. An 8-sector host write into a 256-sector block, handled by naive read/modify/write, rewrites the entire block: a WAF of 32. Modern controllers avoid that by writing to fresh pages and reclaiming stale blocks later through garbage collection, but garbage collection still copies valid pages before each erase, and those copies are writes the host never requested. The same presentation notes small random writes generally produce the highest amplification.
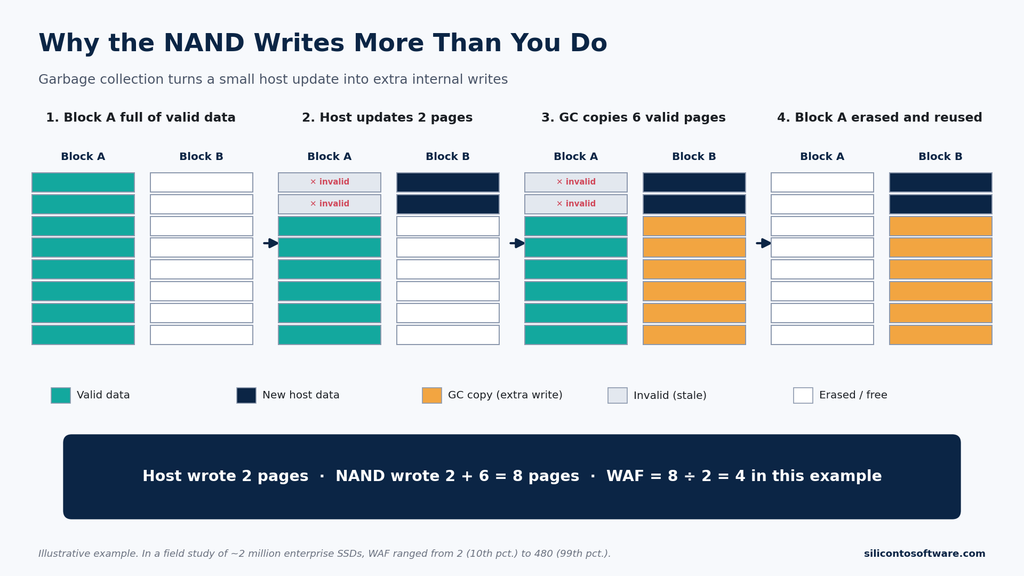
Two textbook levers reduce it. TRIM lets the OS mark deleted data invalid in the flash translation layer, so garbage collection stops copying dead pages. Over-provisioning gives garbage collection more room, so each reclaimed block carries fewer valid pages to move.
Field data complicates the textbook. Across almost 2 million SSDs in NetApp enterprise storage arrays, WAF ran from 2 at the 10th percentile to 480 at the 99th. In that enterprise population, the authors found WAF varied by orders of magnitude between drive families and manufacturers, while over-provisioning and fullness had little measurable effect. Within a single drive family, the authors also found a newer firmware version associated with roughly half the WAF of an older one. For engineers qualifying drives, that makes controller and firmware behavior a first-order endurance variable, one that rarely appears clearly on a datasheet.
If I were qualifying storage for a product, the number I’d most want and least expect to find on a datasheet is write amplification under my own workload. The field data shows how widely it can vary.
How SSD Controllers Fight Wear
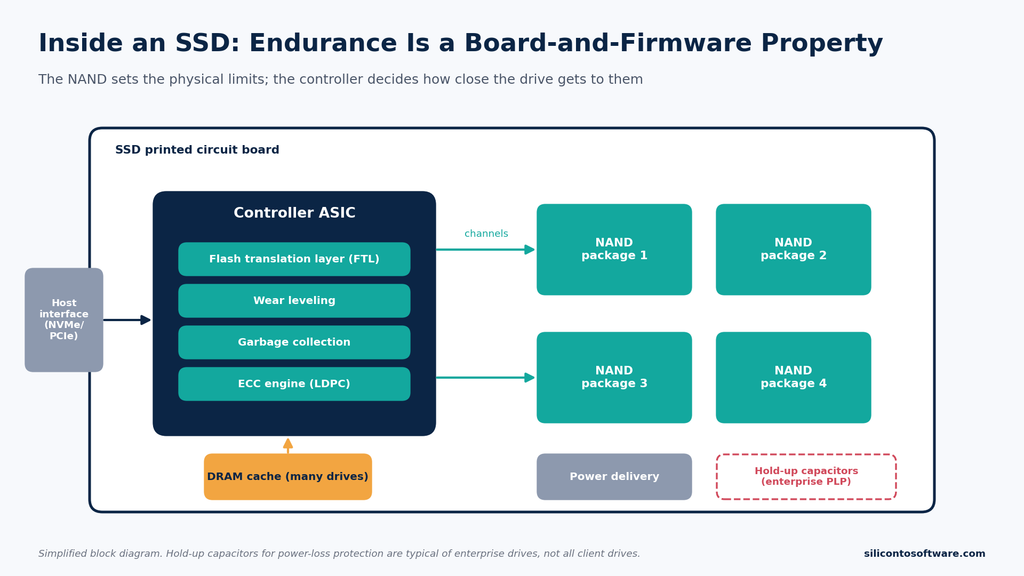
The NAND sets the physical limits. The controller decides how close to them the drive ever operates. Physically, an SSD is a board assembly: a controller ASIC, NAND packages, often DRAM, power delivery, and, on enterprise drives, hold-up capacitors that let the controller flush cached data after sudden power loss. Looking at it from the hardware layer, that’s the point that’s easy to miss: the endurance number on the box isn’t a property of the flash chips. It’s an output of the whole assembly and the firmware running on it.
Wear leveling
Dynamic wear leveling steers new writes to less-worn free blocks. Static wear leveling also relocates cold data that never changes, returning the lightly used blocks underneath it to circulation. The cost is extra writes, which add to WAF.
It’s also imperfect in practice. In the NetApp data, the most-erased block in the median drive saw 55% more erases than average, and 5% of drives had their most-erased block wearing more than six times faster than the average block. JEDEC’s worked endurance example accounts for this, for illustration, by assuming the most heavily cycled block receives twice the average number of cycles.
Error correction: BCH to LDPC
Worn cells produce raw bit errors long before they fail outright. The controller’s job is to keep raw errors from reaching the user.
A 2013 paper described BCH as the code used in commercial SSDs at the time, and found that soft-decision LDPC decoding with six extra sensing levels could tolerate about 3× worse raw bit error rate at the same target failure probability.
LDPC has since been widely adopted in NAND flash. When a fast hard decode fails, the controller re-reads cells using multiple reference voltages to estimate the probability that each holds a 1 or a 0, then decodes again using that soft information.
That capability isn’t free. Soft decoding needs extra reads and more computation, so controllers typically try a fast hard decode first and reach for soft decoding only when that fails. The Carnegie Mellon survey describes the trade directly: LDPC’s multi-read approach provides stronger protection at the cost of greater decoding latency. Early research quantified the stakes: in simulation, the same 2013 paper found that without mitigation, soft-decision decoding could more than double read latency, and that its proposed techniques cut the overhead below 20%. Those 2013 figures come from simulating controllers of that era and shouldn’t be read as a measurement of today’s drives. The direction of the trade still holds: as NAND wears and more reads need the deeper recovery path, the drive pays in latency to return correct data.
This is where the controller buys back the margin that TLC and QLC gave up. It doesn’t buy back everything. Google’s field study found raw bit error rates grew more slowly with wear than commonly assumed, but also that they didn’t predict uncorrectable errors, which the authors suggest may come from different, larger-scale failure mechanisms than the gradual cell wear ECC is designed to absorb.
Spare blocks and over-provisioning
Every SSD reserves NAND the host never sees, both to replace retired blocks and to give garbage collection working room. Drives expose less capacity to the host than their physical NAND configuration might suggest; Samsung notes that its gigabytes are decimal and that a portion of capacity may be used for system and maintenance purposes. Some of that difference can serve as controller-managed spare area, but how it’s divided among over-provisioning, bad-block replacement, and metadata is vendor-specific. In NetApp’s enterprise population, drives commonly shipped with 7% or 28% OP.
As spare capacity runs low, the controller’s ability to retire more failing blocks becomes constrained, and what happens next is firmware-specific. NVMe drives report this directly as Available Spare, with a vendor-set threshold. The Tesla case below shows one documented endpoint: a controller that ran out of the blocks it needed to recover.
What TBW and DWPD Mean for SSD Lifespan
According to JEDEC’s presentation of the standard, the TBW rating is the most data a host can write, under the standard workload for the drive’s class, while the SSD still keeps its capacity, meets its error-rate and functional-failure limits, and retains data powered off for the required time. The governing standard is JESD218, currently revision JESD218C from May 2025. The same presentation lists the class requirements:
| Class | Active use | Power-off retention | Functional failures | UBER |
|---|---|---|---|---|
| Client | 40°C, 8 hrs/day | 1 year at 30°C | ≤3% | 10⁻¹⁵ |
| Enterprise | 55°C, 24 hrs/day | 3 months at 40°C | ≤3% | 10⁻¹⁶ |
Samsung’s datasheet states its endurance testing complies with JESD218.
JEDEC’s worked example shows how the pieces fit together: it keeps TBW below capacity × NAND cycling capability ÷ (2 × WAF), where the factor of two is an example guard band for uneven wear leveling. In practice, that guard band is measured or estimated for each design.
How to calculate DWPD from TBW
DWPD normalizes TBW by capacity and warranty length:
DWPD = TBW ÷ (capacity × warranty days)
For the 990 PRO 1TB, 600 TB ÷ (1 TB × 1,826 days) ≈ 0.33. You could write a third of the drive every day for five years and stay within the rating.
What happens when an SSD passes its TBW rating
For drives whose warranty is limited by TBW, like the 990 PRO, crossing that threshold ends the write-endurance guarantee. It doesn’t, by itself, stop the drive; what happens afterward depends on the drive and its firmware. Western Digital puts the limit precisely: once rated endurance is exhausted, there’s no longer any expectation that data will be retained for a specific period.
The field evidence is mixed, and worth reading carefully. In Google’s study of planar MLC and SLC drives, accelerated life tests didn’t show error rates climbing sharply until around three times the vendor’s P/E limit, and field error rates grew linearly with no sudden jump past the limit within the range observed.
But the same study found field error rates well above what accelerated tests predicted, and between 20% and 63% of drives, depending on the model, hit at least one uncorrectable error in their first four years. Drive age also affected reliability independently of wear. It’s the same lab-versus-field gap behind industrial boards that pass qualification testing and still fail on the factory floor. Those specific numbers shouldn’t be assumed to apply to modern 3D TLC or QLC, but the study shows why P/E endurance alone is an incomplete predictor of drive reliability: the rating isn’t a cliff, and it isn’t the only thing that decides how a drive ages.
My read of the evidence is that TBW is best understood as a contract for write endurance, not a prediction of when a drive will fail. Wear is one factor in SSD lifespan, and not always the dominant one.
How close do real systems come? I found no credible public field data for consumer drives. For enterprise, NetApp’s population ran at a median of 0.36 DWPD, but more than 7% of drives exceeded 3 DWPD and 2% exceeded 10. The median drive sits well below common enterprise endurance ratings. A meaningful tail does not, and that tail is where sizing decisions matter.
How to check your own SSD’s wear
NVMe drives report two useful numbers in their SMART/Health log.
Percentage Used is the more direct gauge. The NVMe specification defines it as a vendor-specific estimate of life used, based on actual usage and the manufacturer’s prediction. A value of 100 means the estimated endurance has been consumed, but the spec states it may not indicate a failure, and the value can exceed 100. The interface standard itself treats the endurance number as an estimate, not a countdown.
Data Units Written counts host writes in thousands of 512-byte units, so each unit represents 512,000 bytes. That’s the figure to compare against TBW. Recent versions of nvme-cli can display it in terabytes.
SSD Data Retention: A Separate Mechanism That Meets Wear at the Spec
Endurance measures how many writes a cell survives. Retention measures how long it holds charge without power. Stored charge leaks faster at higher temperature and through damaged oxide, so a worn cell retains data for less time than a fresh one. That’s why JESD218 defines endurance in terms of end-of-life retention.
The distinction got lost in 2015, when a widely shared claim said SSDs could lose data within days unpowered. JEDEC later called it an erroneous understanding of the retention data, drawn from a 2010 JEDEC presentation. In an interview with PCWorld, the presentation’s author, who chaired JEDEC’s SSD subcommittee when he wrote it, explained that its figures applied only to drives that had reached the end of their rated life and were then stored at abnormal temperatures, not to SSDs in normal use.
Powered drives defend themselves by refreshing blocks that show rising error rates or approach the end of their retention window. That defense has a price. In the NetApp study, the authors attributed the extreme WAF of two outlier drive families mainly to aggressive rewriting of blocks to prevent retention errors. That suggests protecting data from retention loss can consume significant endurance.
For readers, the takeaway is narrow: a lightly used SSD in a drawer isn’t at imminent risk, but an unpowered SSD is not an archive strategy.
When Flash Wear Becomes a Real Failure: The Tesla eMMC Recall
Everything above describes margin. Wear becomes a failure mode when nobody sized that margin to the real workload.
NHTSA recall 21V-035 documents exactly that. Tesla’s filing covered 134,951 Model S and Model X vehicles whose center display used a Hynix 8GB eMMC rated for 3,000 P/E cycles. Once the device reached lifetime wear, the controller could no longer maintain filesystem integrity, which could indirectly take out the rearview camera display, defrost/defog controls, and exterior turn signal lighting.
Tesla’s filing also notes that on vehicles running firmware 2020.48.12 or newer, the rearview camera display continues working after eMMC wear-out. NHTSA’s letter noted that part of the storage was consumed at every vehicle start, until the controller had no blocks left to recover.
Tesla disputed that the wear condition was a defect but recalled voluntarily to close the investigation. The fix combined firmware that warns owners one to six months before lifetime wear with a board swap from the 8GB Hynix eMMC to a 64GB Micron part.
eMMC is embedded managed NAND rather than an SSD, with its own controller and firmware constraints, but the cell physics is the same. For a comparable workload and controller strategy, more usable capacity gives wear leveling a larger pool of blocks to spread writes across, which is why a small device absorbing regular writes, including some at every vehicle start, reaches its cycle limit sooner. The lesson for engineers: size flash by measured write volume and required service life, not by how much data it has to hold. In a vehicle, that’s one more constraint layered on top of the thermal, EMC, and functional-safety requirements that already shape automotive PCB design.
The Trade-off That Keeps Moving
Every step from SLC to QLC gave up physical margin for density, and each time the controller absorbed the difference. Solidigm demonstrated a working five-bit-per-cell PLC SSD in 2022; I haven’t found evidence of a shipping product as of this writing.
The unresolved question is how far error correction and firmware can keep compensating as the voltage window is divided more finely. The physics isn’t getting more forgiving. The controllers are getting better at working around it.
This is the pattern I keep coming back to at Silicon to Software: the spec on the box is the output of a system, not a property of one component. SSD endurance is one of the clearest examples; AI PC NPU TOPS ratings are another, where the compute number says little without the memory bandwidth feeding it.
Your SSD isn’t avoiding wear. It’s managing it, and the number on the box is a warranty contract, not a countdown.
About the Author
Imran Valiani | Sales Director, PCB Electronics Manufacturing
20+ years working with major Bay Area and global tech clients. Founder of Silicon to Software, where I write about the hardware layer — PCB fab, AI gear, autonomous systems, and cyber — the stuff most tech writers have never touched. Literally.
Follow: X @SiToSoftware | LinkedIn
This article was developed with AI assistance and edited, fact-checked, and reviewed by the author. See my full AI disclosure.
Sources
Standards and standards bodies
- JEDEC — “JESD218C: Solid-State Drive (SSD) Requirements and Endurance Test Method” JEDEC Solid State Technology Association, May 2025 (governing standard; revision of JESD218B.03). https://www.jedec.org/standards-documents/focus/flash/solid-state-drives
- Alvin Cox (Seagate), Chairman, JC-64.8 — “JEDEC SSD Specifications Explained” JEDEC presentation, 2010 (explanatory material for JESD218 definitions, class requirements, and worked examples). https://www.jedec.org/sites/default/files/Alvin_Cox%20[Compatibility%20Mode]_0.pdf
- JEDEC — “JEDEC to Update Solid State Drive Standard” JEDEC press release, June 16, 2015. https://www.jedec.org/news/pressreleases/jedec-update-solid-state-drive-standard
- NVM Express — “Specifications” NVM Express, Inc. (governing specification family for the NVMe SMART / Health Information log). https://nvmexpress.org/specifications/
- libnvme — “struct nvme_smart_log – SMART / Health Information Log (Log Identifier 02h)” Ubuntu Manpages (field definitions for Percentage Used, Available Spare, and Data Units Written as implemented from the NVMe specification). https://manpages.ubuntu.com/manpages/noble/man2/nvme_smart_log.2.html
- NVM Express — “Open Source NVMe® SSD Management Utility – NVMe Command Line Interface (NVMe-CLI)” NVM Express, Inc. https://nvmexpress.org/open-source-nvme-ssd-management-utility-nvme-command-line-interface-nvme-cli/
Peer-reviewed research
- Yu Cai, Saugata Ghose, Erich F. Haratsch, Yixin Luo, Onur Mutlu — “Error Characterization, Mitigation, and Recovery in Flash-Memory-Based Solid-State Drives” Proceedings of the IEEE, vol. 105, no. 9, pp. 1666–1704, 2017. DOI: 10.1109/JPROC.2017.2713127. https://doi.org/10.1109/JPROC.2017.2713127 (open-access version: https://arxiv.org/pdf/1706.08642)
- Bianca Schroeder, Raghav Lagisetty, Arif Merchant — “Flash Reliability in Production: The Expected and the Unexpected” 14th USENIX Conference on File and Storage Technologies (FAST ’16), 2016. https://www.usenix.org/conference/fast16/technical-sessions/presentation/schroeder
- Stathis Maneas, Kaveh Mahdaviani, Tim Emami, Bianca Schroeder — “Operational Characteristics of SSDs in Enterprise Storage Systems: A Large-Scale Field Study” 20th USENIX Conference on File and Storage Technologies (FAST ’22), 2022. https://www.usenix.org/conference/fast22/presentation/maneas
- K. Zhao, W. Zhao, H. Sun, X. Zhang, N. Zheng, T. Zhang — “LDPC-in-SSD: Making Advanced Error Correction Codes Work Effectively in Solid State Drives” 11th USENIX Conference on File and Storage Technologies (FAST ’13), 2013. https://www.usenix.org/system/files/conference/fast13/fast13-final125.pdf
- Bongsik Choi et al. — “Comprehensive Evaluation of Early Retention (Fast Charge Loss Within a Few Seconds) Characteristics in Tube-Type 3-D NAND Flash Memory” 2016 IEEE Symposium on VLSI Technology, 2016. https://ieeexplore.ieee.org/document/7573385/
- “Investigation of Retention Characteristics in a Triple-level Charge Trap 3D NAND Flash Memory” IEEE conference publication, IEEE Xplore. https://ieeexplore.ieee.org/document/9764506
- “Improving LDPC Decoding Performance for 3D TLC NAND Flash by LLR Optimization Scheme for Hard and Soft Decision” ACM Transactions on Design Automation of Electronic Systems. DOI: 10.1145/3473305. https://dl.acm.org/doi/10.1145/3473305
- “Solid State Disk Object-Based Storage with Trim Commands” arXiv preprint, 2012. https://arxiv.org/pdf/1210.5975
Regulatory records
- NHTSA — “Part 573 Safety Recall Report 21V-035” (Tesla, Inc.) National Highway Traffic Safety Administration, submitted January 29, 2021. https://static.nhtsa.gov/odi/rcl/2021/RCLRPT-21V035-4682.PDF
- NHTSA Office of Defects Investigation — Recall request letter to Tesla, Inc., EA20-003, National Highway Traffic Safety Administration, January 13, 2021. https://static.nhtsa.gov/odi/inv/2020/INRM-EA20003-11321.pdf
Manufacturer documentation (company-stated)
- Samsung — “Samsung SSD Limited Warranty” (US), Samsung Electronics. https://download.semiconductor.samsung.com/resources/warranty/SAMSUNG_SSD_Limited_Warranty_English_US_10139419044524.pdf
- Samsung — “Samsung V-NAND SSD 990 PRO Data Sheet,” Revision 2.0, Samsung Electronics. https://download.semiconductor.samsung.com/resources/data-sheet/samsung_nvme_ssd_990_pro_datasheet_rev.2.0.pdf
- Micron — “Micron Ships World’s First 176-Layer NAND, Delivering A Breakthrough in Flash Memory Performance and Density” Micron Technology press release, November 9, 2020. https://investors.micron.com/news-releases/news-release-details/micron-ships-worlds-first-176-layer-nand-delivering-breakthrough
- Solidigm — “Replace Legacy Storage in Content-Delivery Networks with Cost-Effective, High Capacity Solidigm™ D5 Series SSDs” Solidigm. https://www.solidigm.com/products/technology/replace-hdd-for-content-delivery-systems-with-solidigm-d5-series-ssds.html
- Solidigm — “Read-intensive workload QLCs for Cloud Storage and Enterprise Data” Solidigm. https://www.solidigm.com/products/technology/read-dominant-workload-qlc-for-cloud-enterprise-storage.html
- Solidigm — “Solidigm Demonstrates World’s First Penta-Level Cell SSD at Flash Memory Summit” Solidigm Newsroom, 2022. https://news.solidigm.com/en-WW/217006-solidigm-demonstrates-world-s-first-penta-level-cell-ssd-at-flash-memory-summit/
- Western Digital — “White Paper: SSD Endurance and HDD Workloads.” Western Digital. https://documents.westerndigital.com/content/dam/doc-library/en_us/assets/public/western-digital/collateral/white-paper/white-paper-ssd-endurance-and-hdd-workloads.pdf
- Kingston Technology — “SSD Power Loss Protection: How Hardware & Firmware PLP Prevent Data Loss.” Kingston Technology. https://www.kingston.com/unitedkingdom/en/blog/servers-and-data-centers/ssd-power-loss-protection
- Virtium — “Temperature Considerations for Industrial Embedded SSDs” Virtium. https://www.virtium.com/technology-updates/temperature-considerations-for-industrial-embedded-ssds/
Technical journalism
- Gordon Mah Ung — “Debunked: Your SSD won’t lose data if left unplugged after all” PCWorld, May 21, 2015 (interview with the author of the JEDEC presentation). https://www.pcworld.com/article/427602/debunked-your-ssd-wont-lose-data-if-left-unplugged-after-all.html