NVIDIA’s 800V DC Architecture: The Power Problem It Doesn’t Solve
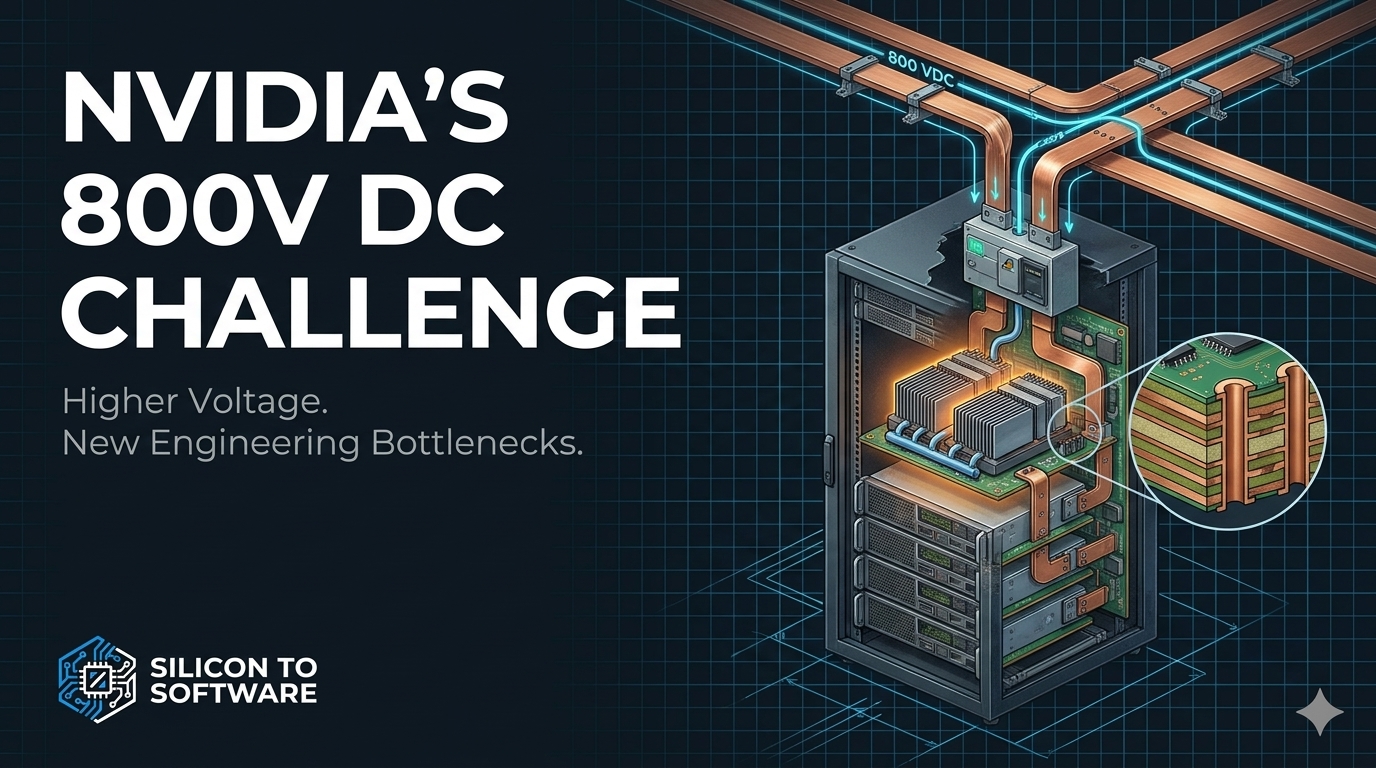
Higher voltage reduces the current burden of megawatt AI racks, but shifts critical design challenges into converters, busways, protection systems, and manufacturing.
Table of Contents
1. The 18,500-amp problem
A one-megawatt AI rack running on a 54-volt bus has to move about 18,500 amps. At 800 volts, the same rack draws 1,250. That one line of Ohm’s-law arithmetic is the core of NVIDIA’s case for 800 VDC power distribution, and it is where most coverage of the NVIDIA 800V DC architecture stops.
The case is real. NVIDIA estimates that a 1 MW rack fed at 54 V would need up to 200 kg of copper busbar, and that its power shelves would consume up to 64 rack units — leaving no room for GPUs (NVIDIA, May 2025). Those are NVIDIA’s estimates for a rack that does not exist yet, but the physics behind them is not controversial.
The pressure comes from the network, not the chip alone. NVLink scale-up domains run over copper, and copper’s reach is short, so more GPUs must share one rack to act as one system. NVIDIA says the move from Hopper to Blackwell raised GPU thermal design power by 75% but rack power density by 3.4x, because the NVLink domain grew to 72 GPUs (NVIDIA, Oct 2025).
Here is the turn. The 15x current reduction holds only against a 54 V bus. Against three-phase AC at 415 or 480 V, the line current at 1 MW is 1,391 A or 1,203 A, close to the 1,250 A of an 800 VDC feed. And the first 800 VDC hardware, slated for production in Q3 2026 (NVIDIA White Paper V2), converts back to 54 V inside the compute rack.
So what does 800 VDC actually change, and who inherits the hard parts? This article is not a case for or against the architecture. It is a map of where the engineering went: into converters, insulation, connectors, busways, protection, thermal management, and manufacturing qualification.
Throughout, we separate four kinds of evidence: NVIDIA or vendor projections, our own calculations (with assumptions stated), announced product capabilities, and independently measured results. As of October 21, 2026, we found no published independent measurements of an operating 800 VDC AI data hall.
2. What NVIDIA proposed, and how the plan changed
NVIDIA’s May 2025 plan was ambitious: convert 13.8 kV utility power to 800 VDC at the facility perimeter, distribute DC through the hall, and support 1 MW racks “starting in 2027” alongside the Kyber rack generation (NVIDIA, May 2025).
By 2026 the framing had changed. NVIDIA’s second white paper says 800 VDC will coexist with 415/480 VAC rather than replace it, and defines three deployment options (NVIDIA White Paper V2, 2026):
| Option | Where AC becomes 800 VDC | Stated scale | NVIDIA’s stated timing |
|---|---|---|---|
| A — Power Rack | Sidecar beside compute racks, fed from existing AC | ~660 kW | Production Q3 2026 |
| B — Power Center | End-of-row rectifier, overhead 800 VDC busway | Up to 2 MW | “As soon as” Q3 2027 |
| C — DC Power Block | Data-hall transformer-rectifier or solid-state transformer | ~4.8 MW blocks | No date; next-gen SST “toward 2029” |
Google, Microsoft and NVIDIA are aligning requirements through the Open Compute Project, which describes 800 VDC as an additional option, not a replacement for AC (OCP, Aug 2026).
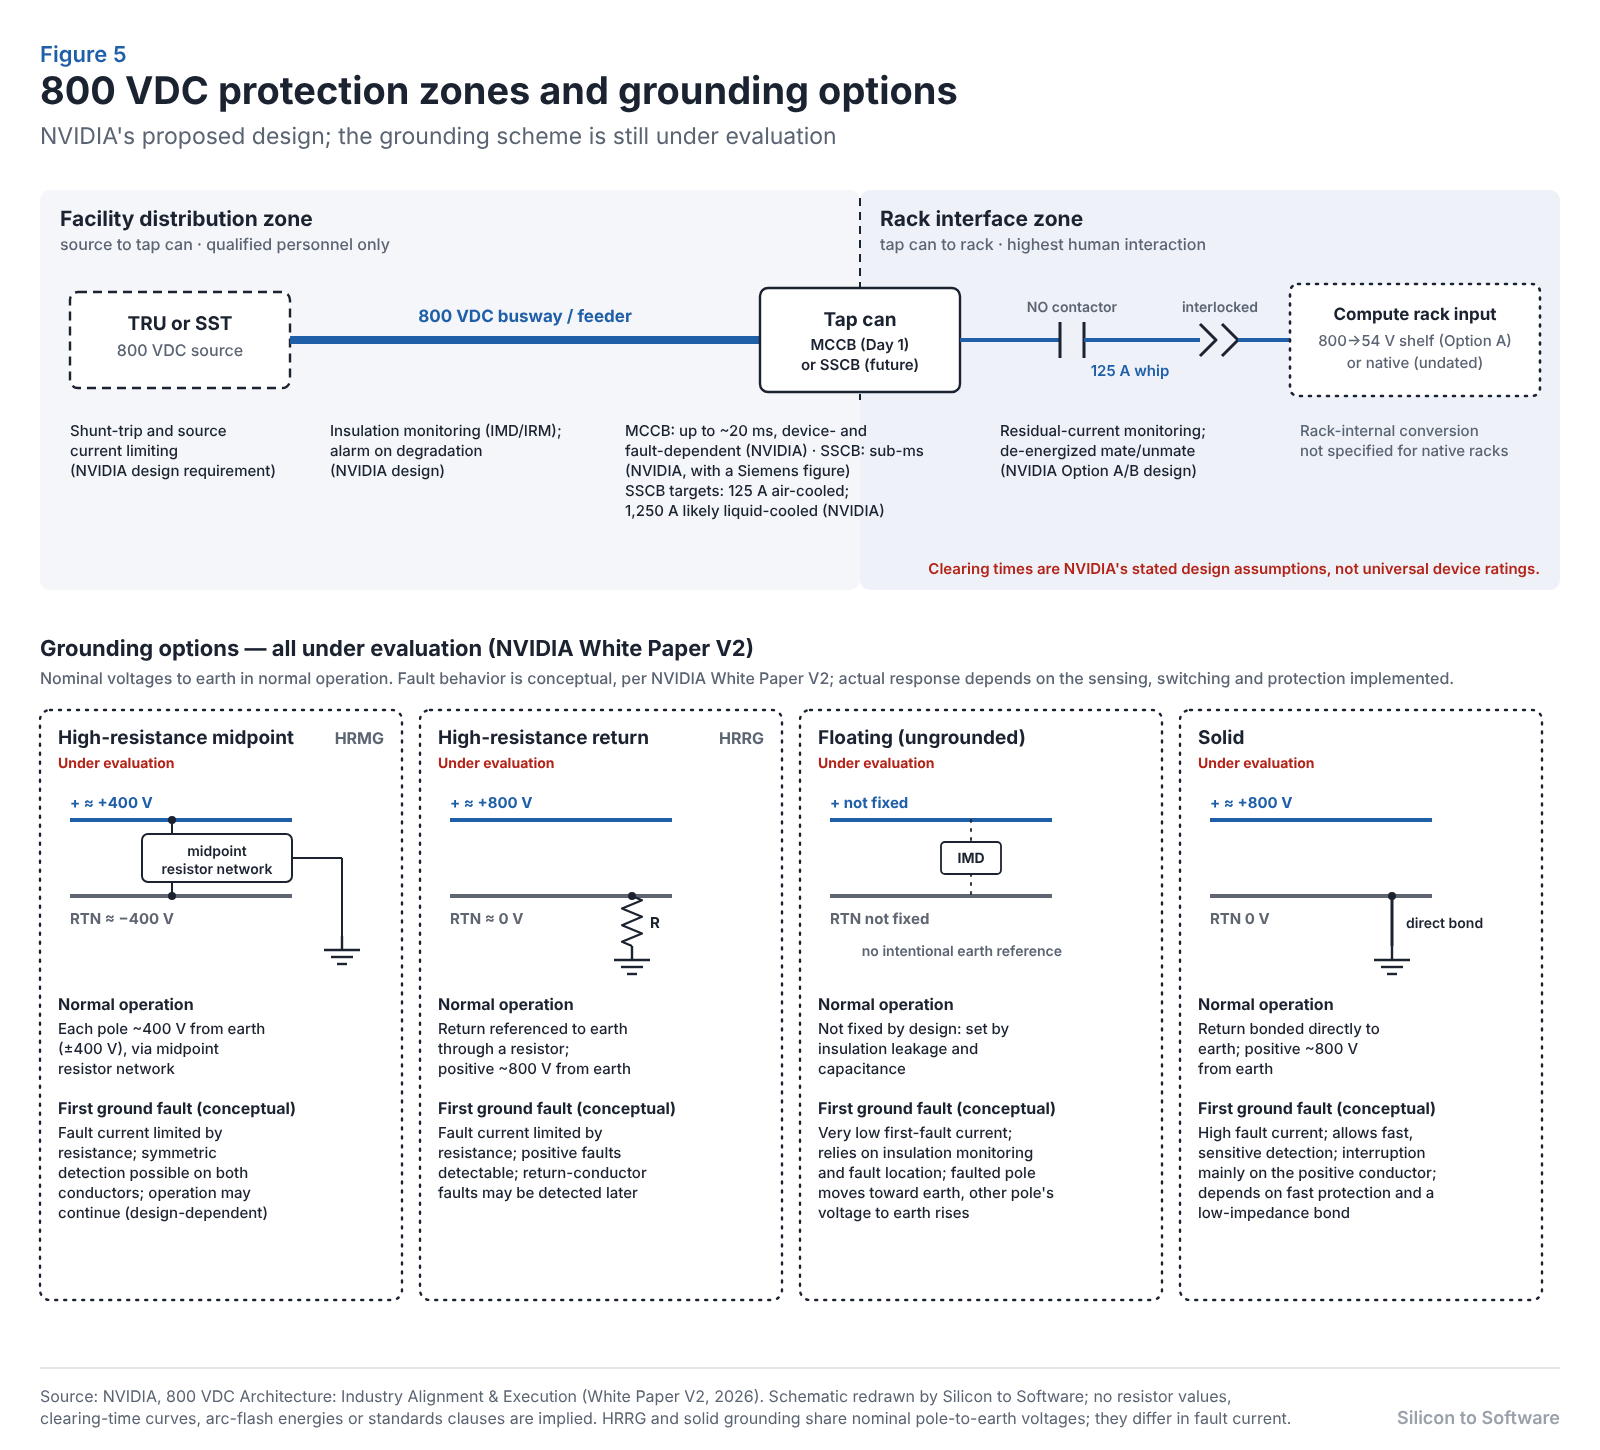
Two definitions matter. “800 V” is a distribution voltage; GPU cores still run from sub-1 V rails fed by 12 V or 6 V buses. And it is a nominal pole-to-pole voltage on a two-wire system, implementable as ±400 V or 0–800 V, with grounding still undecided (Section 8).
NVIDIA also plans to keep 54 V in-rack distribution for its next generations, reaching up to 570 kW per rack position with liquid-cooled power shelves and busbars. A native 800 V rack (“Gen 4”) follows, undated. TrendForce expected the 800 V power rack to ship in 3Q26 as an optional Vera Rubin configuration, with broader adoption after Rubin Ultra in 2H 2027 (TrendForce, Jun 2026); that is an analyst estimate, not an NVIDIA statement.
Update, October 21, 2026. At GTC Berlin, NVIDIA announced DSX POD, a factory-built, containerized AI factory built around Vera Rubin NVL72 racks, seven per container according to The New Stack. NVIDIA says it is working with partners including Delta, Eaton, Schneider Electric and Vertiv to deliver DSX POD AI factories worldwide “in early 2027” (NVIDIA press release, Oct 21, 2026). NVIDIA’s technical blog states that DSX POD “makes power delivery seamless with a standard input 800 VDC power design.” The reference design covers the container’s electrical input and “continues through protection, distribution, grounding, rack connections, controls, and telemetry,” while partners “engineer the upstream generation, conversion, and regional electrical solution for the customer site” (NVIDIA Technical Blog, Oct 21, 2026). The announcement adds a dated product with a defined 800 VDC interface to NVIDIA’s roadmap; it is not evidence of measured efficiency, native 800 V compute racks, or operating customer installations. The blog does not specify the grounding scheme, protection devices, per-rack power, or certification status.
3. Two comparisons, not one
Most confusion about 800 VDC comes from mixing baselines. Against a 54 V in-rack bus, the advantage is overwhelming. Against 415 or 480 VAC, it is moderate, and it depends on what you measure.
3a. Against 54 V: decisive
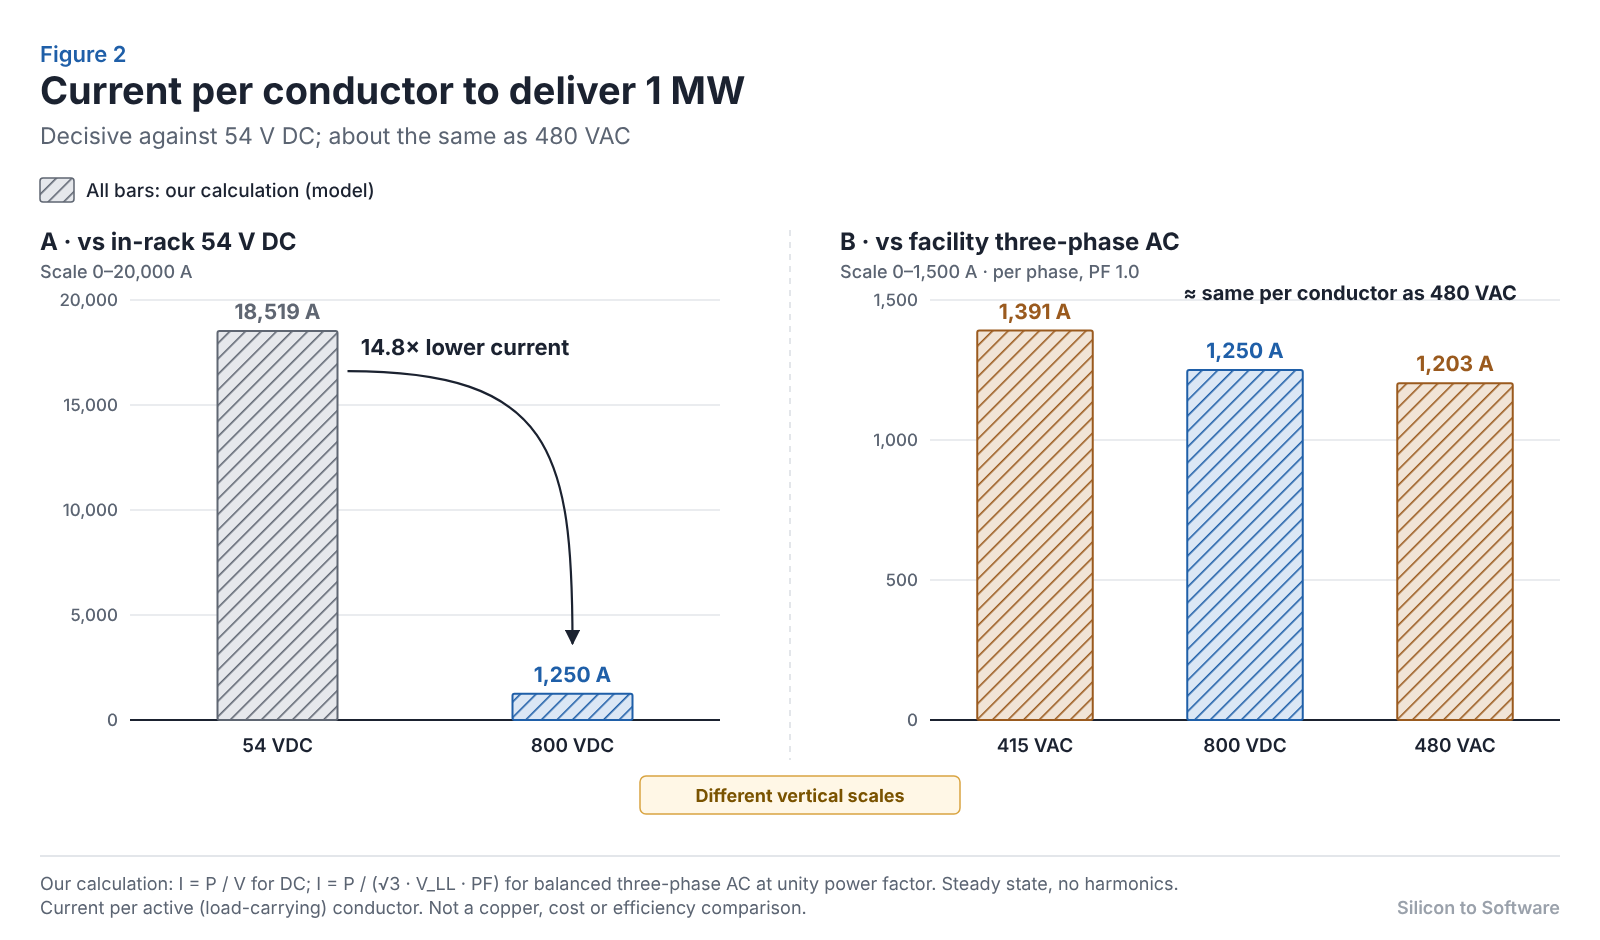
I = P / V → at P = 1 MW: I(54 V) = 1 MW ÷ 54 V ≈ 18,519 A; I(800 V) = 1 MW ÷ 800 V = 1,250 A
That is 14.8 times less current and, through the same conductor, about 219 times less I²R loss. As a scaling illustration only: a 20 µΩ path would dissipate about 6.9 kW at 54 V and 31 W at 800 V. No one would build both buses with the same resistance; real busbars are sized for temperature rise, which is why a 54 V megawatt rack heads toward hundreds of kilograms of copper.
3b. Against 415/480 VAC: moderate, and easy to overstate
I(line) = P / (√3 × V(LL) × PF), where V(LL) is the line-to-line voltage and PF the power factor
At 1 MW and unity power factor, line current is 1,203 A at 480 VAC and 1,391 A at 415 VAC. An 800 VDC feed carries 1,250 A. Per conductor, 800 VDC and 480 VAC carry almost the same current. The difference is conductor count: three active (load-carrying) conductors for three-phase AC, two for DC. Neutral carries only imbalance and harmonic current, and protective earth (PE) carries none in normal operation; neither is equivalent copper.
Table 1 — Two baselines at 1 MW (our calculations)
| Baseline | Current per active conductor (A) | Active conductors | Power per active conductor, 800 VDC vs baseline | Loss in active conductors, 800 VDC vs baseline (same conductor size) |
|---|---|---|---|---|
| 54 VDC | 18,519 | 2 | 14.8x higher | ~219x lower, only if conductor resistance is held equal (illustrative; real 54 V and 800 V conductors are sized differently) |
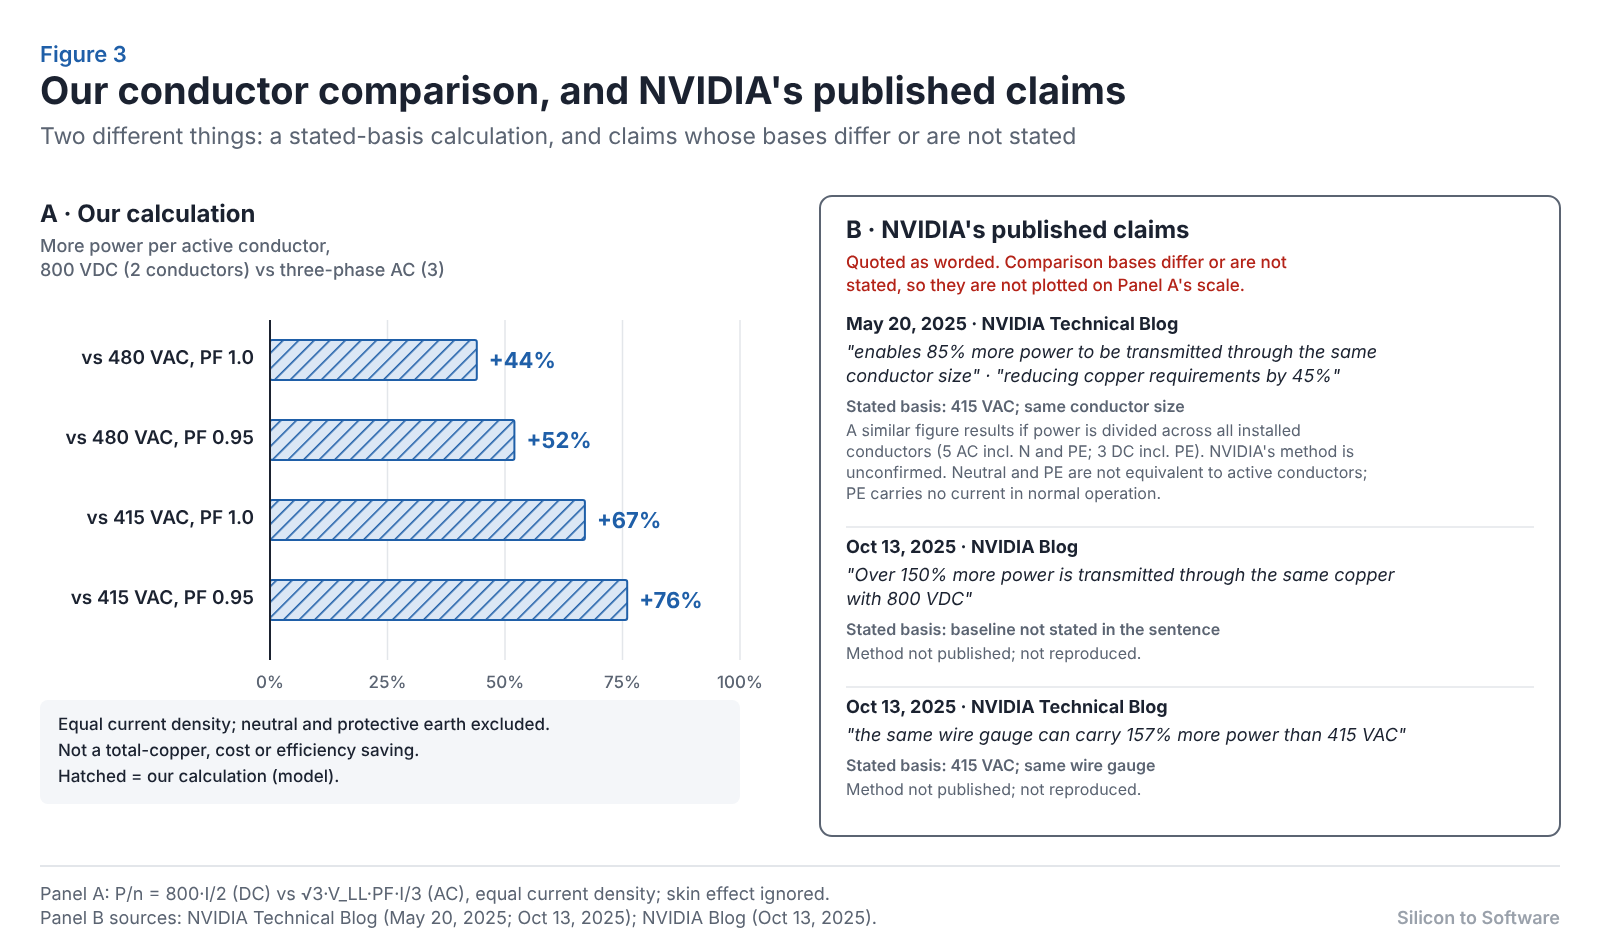
| 480 VAC, PF 1.00 / 0.95 | 1,203 / 1,266 | 3 | +44% / +52% | −28% / −35% |
| 415 VAC, PF 1.00 / 0.95 | 1,391 / 1,464 | 3 | +67% / +76% | −46% / −51% |
Assumptions: steady state, balanced load, no harmonics, equal cross-section per active conductor, skin effect ignored (it modestly favors DC at large sizes). Power per conductor uses P/n = 800·I/2 for DC and √3·V·PF·I/3 for AC; loss uses n·I²R. This is an idealized conductor-only comparison: it cannot be used directly to size conductors or predict installed busway losses, which also depend on ampacity rules, conductor arrangement, AC proximity effect, terminations and permissible temperature rise.
What Table 1 does not show. The +44% to +76% figure is power per active conductor at equal current density. It is not a total-copper, cost or efficiency saving:
- Total conductor material follows ampacity tables, derating, redundancy, and neutral and earth sizing rules, which differ between systems.
- Power factor in modern supplies with active correction is near unity, so the PF 0.95 rows flatter DC.
- System architecture decides which conductors exist. In Options A and B the upstream AC feeders remain; only the last segment becomes DC.
NVIDIA’s copper claims, in context. NVIDIA has published three figures for similar comparisons. Its May 2025 claim (NVIDIA tech blog) — 85% more power through the same conductor size versus 415 VAC, and a 45% reduction in copper requirements — comes with no published method. A similar percentage results if delivered power is divided equally across every installed conductor (five for AC including neutral and PE; three for DC including PE), but we cannot establish that NVIDIA used that convention. Either way, neutral and PE are not equivalent to active conductors, as noted above. Its October 2025 figures — “over 150%” more power through the same copper (NVIDIA blog) and 157% more power with the same wire gauge (NVIDIA tech blog) — could not be reproduced from any consistent assumption we tested. NVIDIA has not published its method; engineers should use active-conductor figures with stated assumptions.
4. The transitional rack vs the native rack
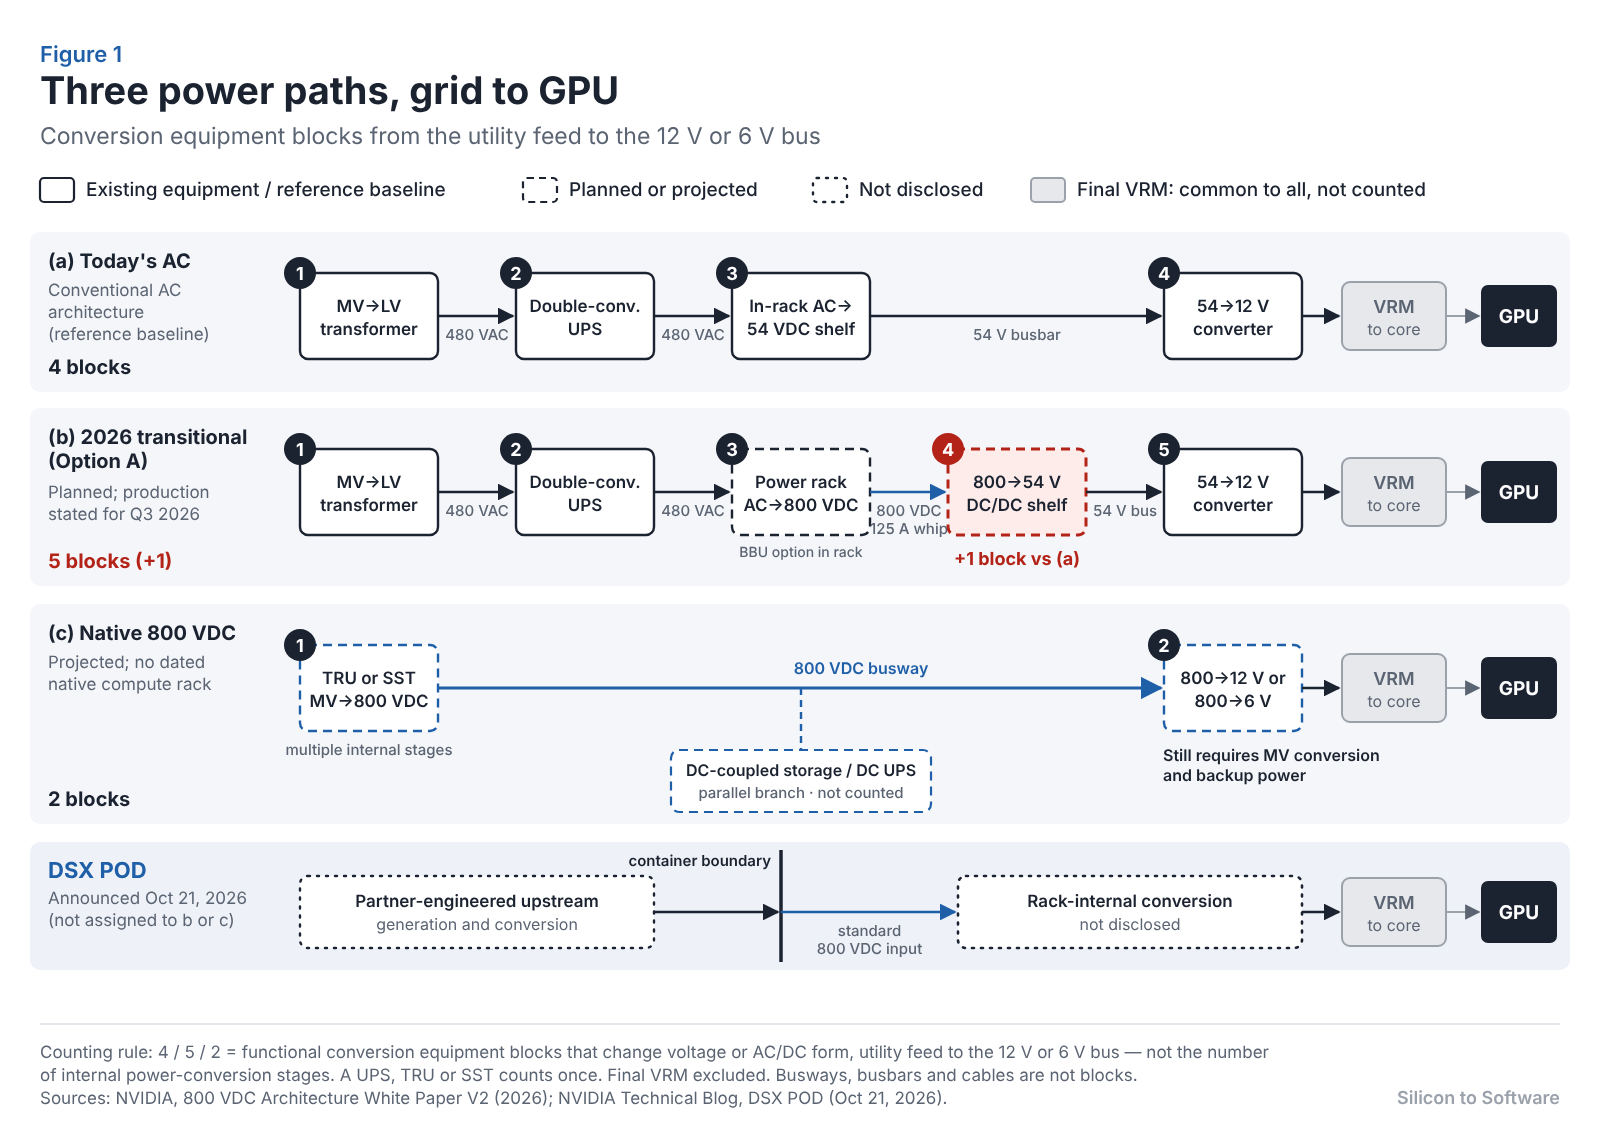
“800 VDC rack” currently means two very different things. Most published comparisons blur them. Figure 1, at the end of Section 2, shows both paths alongside today’s AC baseline.
(a) Today’s AC rack. Medium voltage is stepped down to 415/480 VAC, passes through a UPS, and reaches in-rack power shelves that convert AC to 54 VDC. A 54 V busbar feeds compute trays, where intermediate bus converters step down to 12 V and voltage regulators produce the sub-1 V core rails.
(b) The 2026 transitional rack (Option A). The facility is unchanged up to 480 VAC. A power rack beside the compute rack converts AC to 800 VDC using 6 × 18.3 kW power supplies per shelf, at about 660 kW per power rack. Interlocked 125 A DC cables carry 800 V into the compute rack. There, an 800 V-to-54 V DC/DC shelf (6 × 15 kW) feeds the same 54 V busbar used today (NVIDIA White Paper V2).
(c) The native 800 V rack (Gen 4). 800 VDC arrives from a row or data-hall source and is converted directly to 12 V or 6 V near the GPU, with no 54 V bus. NVIDIA has described this for Kyber (NVIDIA tech blog, Oct 2025) but its 2026 white paper attaches no date to a native product.
The transitional design solves real problems. It moves AC/DC conversion out of the compute rack into a separate power rack that can also host battery backup units (NVIDIA White Paper V2), frees rack space, and gives the industry an 800 V interface to qualify against before facilities change. NVIDIA chose this path deliberately, so it could reuse existing AC power-shelf designs and existing certification methods while limiting 800 V exposure on the data-hall floor.
What it does not do is remove a conversion stage. Path (b) has one more conversion than path (a): AC→800 V in the power rack, then 800 V→54 V in the compute rack, where today there is a single AC→54 V step. NVIDIA’s efficiency projection therefore describes path (c). For path (b), the extra stage adds loss in our illustrative model (Section 5), but whether a given transitional installation performs better or worse overall depends on what it replaces — in-rack supply efficiency, UPS mode, battery placement, cooling and load profile — and no measured comparison has been published.
NVIDIA’s October 21 DSX POD announcement does not resolve this distinction. Its technical blog confirms an 800 VDC input at the container boundary, but it does not say whether the Vera Rubin NVL72 compute racks inside convert 800 V to 54 V internally, as in Option A, or convert natively to 12 V or 6 V (NVIDIA Technical Blog). An 800 VDC interface at the container is not evidence of a native 800 V compute rack.
5. Where the efficiency actually comes from
NVIDIA projects up to 5% better end-to-end efficiency than “current 54 V systems,” up to 70% lower maintenance cost and up to 30% lower total cost of ownership (NVIDIA, May 2025). It has not published the baseline, load profile or method, and its 2026 white paper lists cost and reliability assessment as future work.
To illustrate how conversion-stage assumptions move end-to-end efficiency, we built a simple chain model. The results are illustrative, not measured. They depend on the architecture, the operating load point and the components chosen; every stage value below is an assumed peak-class efficiency.
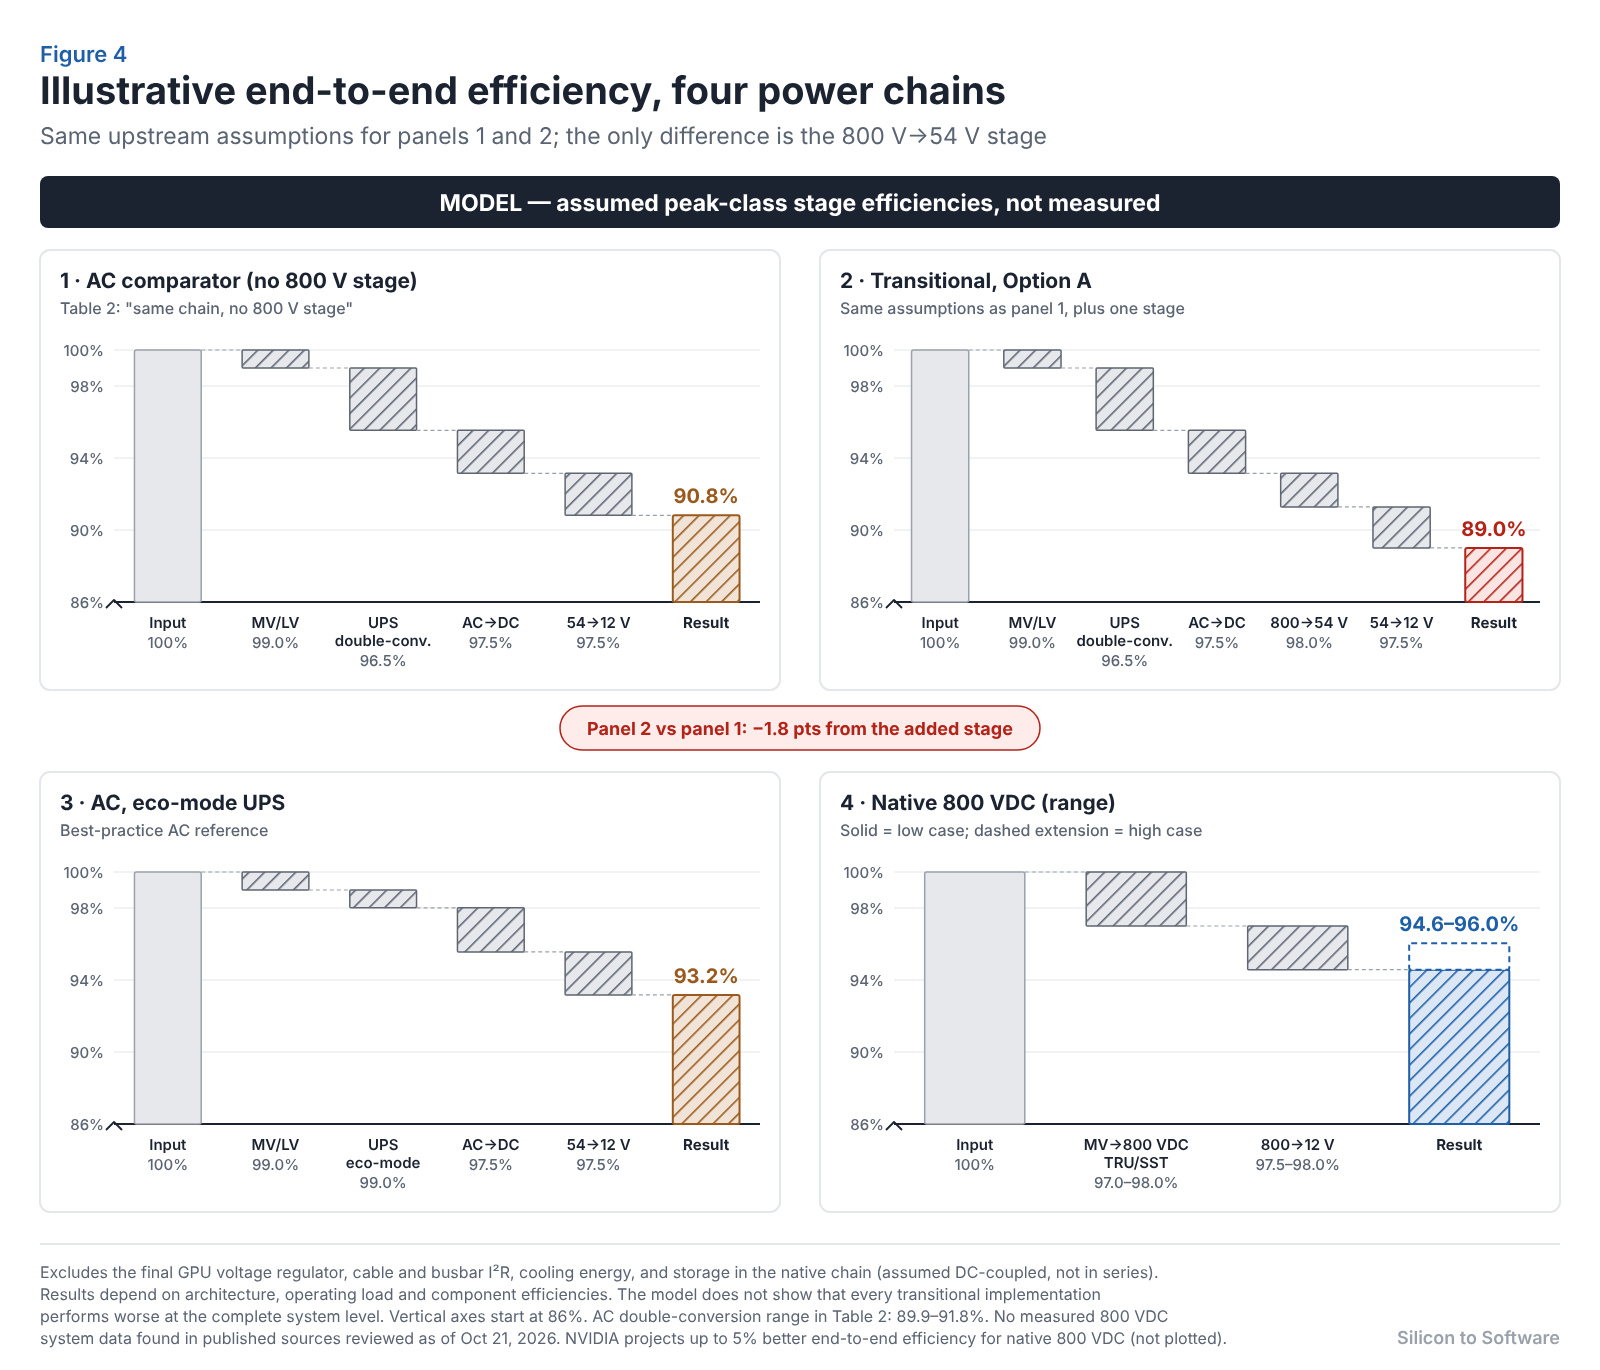
Table 2 — Illustrative conversion-chain model (our calculation)
| Architecture | MV→LV xfmr | UPS | AC→DC | 800→54 V | 54→12 V | MV→800 VDC | 800→12 V | Product |
|---|---|---|---|---|---|---|---|---|
| AC, double-conversion (low) | 99.0% | 96.0% | 97.5% | — | 97.0% | — | — | 89.9% |
| AC, double-conversion (high) | 99.0% | 97.0% | 97.5% | — | 98.0% | — | — | 91.8% |
| AC, eco-mode UPS | 99.0% | 99.0% | 97.5% | — | 97.5% | — | — | 93.2% |
| Transitional (Option A) | 99.0% | 96.5% | 97.5% | 98.0% | 97.5% | — | — | 89.0% |
| Same chain, no 800 V stage | 99.0% | 96.5% | 97.5% | — | 97.5% | — | — | 90.8% |
| Native 800 VDC (low) | — | — | — | — | — | 97.0% | 97.5% | 94.6% |
| Native 800 VDC (high) | — | — | — | — | — | 98.0% | 98.0% | 96.0% |
Excluded: the final GPU voltage regulator (common to all), cable and busbar I²R, cooling energy, and storage in the native chain (assumed DC-coupled, not in series).
In this model, a native chain gains about 2.8 to 6.1 points over double-conversion AC across the displayed endpoints (94.6–96.0% against 89.9–91.8%); pairing low cases with low cases and high with high gives 4.7 and 4.2 points. NVIDIA projects an end-to-end efficiency improvement of “up to 5%” relative to current 54 V systems, without specifying whether that means a relative percentage or percentage points. Our illustrative model produces differences of 2.8–6.1 percentage points, equivalent to approximately 3.1–6.8% relative improvement across the compared endpoints. Although those ranges overlap NVIDIA’s numerical claim under either interpretation, they do not independently validate it because the modeled system boundaries, operating conditions and reference baselines have not been established as equivalent. Against eco-mode AC (93.2%) the gain is only about 1.4 to 2.8 points. These are illustrative assumptions, not measured performance.
The transitional chain comes out 1.8 points lower (89.0% against 90.8%) than the same AC chain without the extra stage. That result follows from adding one conversion at an assumed 98%; it does not show that every transitional implementation must perform worse at the complete system level. A real Option A deployment may also change the in-rack supply’s efficiency, place battery backup in the power rack, alter cooling load, or replace an older AC chain than the one modeled, and any of these can offset the extra stage. Peak values also flatter every row: AI training loads swing between roughly 30% and 100% of rack power in milliseconds (NVIDIA, Oct 2025), and at cluster scale such synchronized swings can reach tens or hundreds of megawatts (NVIDIA/Microsoft/OpenAI, 2025), so load-weighted efficiency matters more, and we found none published for 800 VDC systems.
History counsels caution. A 2008 California Energy Commission brief on Lawrence Berkeley National Laboratory’s demonstration found that 380 VDC distribution could cut total data center energy use by 5 to 7% against the most efficient AC systems, and by up to 28% against typical AC distribution (CEC/LBNL, 2008); the larger figure is often repeated as “28% more efficient than 208 VAC” (IEEE Electrification Magazine, 2016). Schneider Electric countered that against the most efficient AC designs the difference was typically 1% or less, and that AC with an eco-mode UPS could be about 1% more efficient (Schneider, 2013). The baseline decides the headline.
Table 3 — Evidence ledger
| Claim | NVIDIA projection | Our model | Historical finding | Independently measured (in sources reviewed) |
|---|---|---|---|---|
| End-to-end efficiency | Up to +5% vs 54 V systems | Native ~+2.8 to +6.1 pts vs double-conversion (endpoint range; ~+1.4 to +2.8 vs eco-mode); Option A −1.8 pts vs the same chain (model only; not a system-level result) | 380 VDC: up to 28% lower energy use vs typical AC and 5–7% vs most efficient AC (CEC/LBNL, 2008) to ~1% or less (vs most efficient AC, Schneider) | None published for 800 VDC |
| Maintenance cost | Up to −70% | Not calculable from public data | — | None published |
| Total cost of ownership | Up to −30% | Not calculable from public data | 380 VDC: up to 15% lower cost from eliminated components and simpler distribution (LBNL, via IEEE Electrification Magazine); not a TCO figure; cost basis not stated | None published |
| Reliability | Fewer conversions, fewer PSU failures | Larger fault domains offset part of it | 380 VDC more reliable in Monte Carlo modeling (Shrestha et al., 2018) | None published |
6. Conversion electronics: SiC, GaN and stacked topologies
Higher distribution voltage moves the hardest conversion closer to the GPU. A native rack must take 800 V down to 12 V or 6 V, at kilowatts per module, inside a compute tray. The published designs split by stage rather than converge on one device.
Table 4 — Conversion stage map
| Stage | Devices in use | Evidence |
|---|---|---|
| MV AC → 800 VDC, solid-state transformer | Medium-voltage SiC described as the key enabling device (Wolfspeed, vendor); most commercial SSTs are ~15 kV-class input (NVIDIA) | NVIDIA White Paper V2; Wolfspeed, Mar 2026 |
| MV AC → 800 VDC, transformer-rectifier | IGBT rectifiers from UPS designs, or aggregated SiC shelves | NVIDIA White Paper V2 |
| 480 VAC → 800 VDC power rack | 1,200 V SiC MOSFETs for 800 V-bus AC/DC rectification and DC/DC conversion (Wolfspeed) | Wolfspeed, Mar 2026 (vendor) |
| 800 V → 12 V | 700 V GaN primary in an 850 kHz LLC, 6 kW (ST); 650 V CoolGaN in an input-series half-bridge LLC with matrix transformer, 6 kW (Infineon, per trade reports); eight ~100 V-input LLC modules in series at the input, 150 V GaN primaries, 1 MHz, 6 kW (EPC) | Power Electronics News, Mar 2026 (announced) |
| 800 V → 6 V | 120 V GaN in a 650 kHz eight-level stacked LLC, 20 kW (ST); sixteen 650 V GaN FETs in a 1 MHz stacked full-bridge (Navitas); integrated GaN in an isolated bus converter, topology not disclosed (TI) | Power Electronics News (announced) |
| 6–12 V output, hundreds to thousands of amps | 25–40 V silicon MOSFETs or 40 V GaN | Power Electronics News |
Table 4 sources (checked Oct 20–21, 2026): transformer-rectifier and SST rows — NVIDIA White Paper V2, Wolfspeed (vendor); ST — ST blog (primary; primary-side arrangement of the 800 V-to-12 V board not disclosed); EPC — EPC white paper (primary); TI — TI release via StockTitan (primary text, republished); Navitas — Navitas release via GlobeNewswire (primary text, republished; efficiency stated as a target); Infineon — Power Electronics News and Semiconductor Today (trade reports; Infineon’s own release for this design was not located). All efficiency and density figures are vendor-reported.
Neither SiC nor GaN is mandatory: IGBT transformer-rectifiers and silicon output stages sit in the same architecture. Wide-bandgap devices buy switching frequency and density. The announced 800 V-to-12 V and -6 V modules report 96.5–98.2% peak efficiency at 2,000–2,500 W/in³ (vendor-reported peaks for reference designs; Navitas’s 96.5% is a stated target, not a measured result). Eltek already lists 98.2% peak efficiency at 33 W/in³ for its 380 V-to-54 V data-center converter (manufacturer specification); the efficiency is not new, the density is.
The hidden cost of stacking. A 650 V GaN transistor cannot block an 800 V bus with design margin, so several published GaN designs split the input across stacked or series-input stages (EPC and Infineon at 12 V; ST’s eight-level and Navitas’s stacked full-bridge designs at 6 V). ST’s 800 V-to-12 V board instead uses 700 V GaN in an LLC; ST’s 2025 800 V-to-50 V design used 650 V GaN in a stacked half-bridge; its March 2026 update says the 12 V board uses “the same 700 V GaN power transistor as the system featured in 2025.” Because ST’s descriptions conflict and the 12 V board’s primary arrangement is not described, its voltage-stress arrangement remains unconfirmed and is not illustrated here. Depending on the topology, dividing the input voltage across multiple stages can increase device count, magnetic-component complexity, voltage-balancing requirements, and assembly interconnections. Those trade-offs must be evaluated against efficiency, power density, thermal performance, and reliability. A 1,200 V SiC device blocks 800 V alone but switches slower. The topology is a reliability and manufacturing choice as much as an efficiency one.
The topology is still moving. NVIDIA’s 2025 Kyber description (NVIDIA tech blog) used a 64:1 LLC from 800 V to 12 V, claimed to need 26% less area than multi-stage designs, with no efficiency figure. At GTC 2026, TI, ST and Navitas showed direct 800 V-to-6 V converters, and Power Electronics News reports that ST expects 50 V, 12 V and 6 V buses to coexist (Power Electronics News). No power-cycling, operating-life or field-return data specific to these modules has been published; their reliability claims are vendor qualification claims.
7. The PCB and manufacturing burden
The converters in Section 6 put an 800 V primary and a 6 V or 12 V secondary carrying hundreds to thousands of amps on the same assembly (about 500 A for a 6 kW, 12 V module; more than 3,000 A for ST’s 20 kW, 6 V design), at vendor-reported module densities of 2,000–2,500 W/in³. That is where 800 VDC becomes a printed-circuit-board and manufacturing problem — the part marketing slides skip and factories will live with for a decade.
No spacing values appear below. Creepage and clearance distances come from the governing product standard and the insulation coordination standard it references — for low-voltage equipment, IEC 60664-1, which covers up to 1,500 VDC, 30 kHz and 2,000 m altitude (IEC). They must be read from the applicable edition for each product, not estimated from “800 V.” High-frequency insulation stress requires separate consideration. IEC 60664-4 addresses periodic voltage stress with fundamental frequencies above 30 kHz and up to 10 MHz, but its published scope specifies equipment rated up to 1,000 VAC and does not explicitly establish an 800 VDC equipment rating. Applicability to a particular converter’s insulation system must be assessed against the actual voltage waveform, applicable product standard and certification requirements.
Insulation coordination starts before layout
Spacing is not one number. It depends on the working voltage across each barrier (which, as Section 8 explains, is not simply 800 V), the pollution degree, the laminate’s material group, the insulation class required (functional, basic, supplementary or reinforced), and whether the path is clearance through air or creepage along a surface. Clearance is driven mainly by the transient overvoltage the circuit must withstand and by altitude; creepage by working voltage, contamination and tracking resistance. The scheme must be fixed before placement: discovering late that a tray runs at a higher pollution degree inside a liquid-cooled chassis can force a re-layout.
Laminate properties
At 800 V the laminate is part of the safety design:
- Comparative tracking index (CTI) sets the material group and how much surface distance a voltage needs.
- Conductive anodic filament (CAF) resistance matters between closely spaced vias under sustained DC bias and humidity.
- Moisture absorption degrades surface and bulk insulation where condensation is possible.
- Dielectric strength and thickness control of prepreg define inner-layer and planar-transformer barriers.
- Glass transition and Z-axis expansion govern via reliability under thermal cycling.
High-CTI, CAF-resistant materials exist, but they narrow supplier choice and can trade against the dielectric and thermal properties the power stage wants.
Fabrication tolerances and conductor geometry
Creepage is the shortest applicable path along an insulating surface; clearance is the shortest applicable distance through air. Both must be evaluated using actual finished conductor geometry and applicable manufacturing tolerances, rather than relying solely on nominal CAD dimensions. Etch tolerance, outer-layer plating build-up, solder-mask registration and drill-to-copper tolerance all shrink real spacing. Thick copper for kiloamp secondaries etches with wider tolerance, making the same nominal gap less predictable. Sharp corners and pad edges concentrate electric field; routed slots can lengthen creepage paths only if their width and position are held. Design rules should use worst-case finished dimensions and the fabricator’s real capability data. Solder mask should not automatically be credited as an insulation barrier; any credit for coatings or insulating materials depends on the applicable requirements and their qualification.
Isolation barriers
High-ratio planar or matrix transformers embed the primary-to-secondary barrier in prepreg layers. Voids, resin starvation, misregistration and delamination create partial-discharge sites, so partial-discharge behavior under the converter’s high-dv/dt switching waveform — not only under DC — becomes a qualification parameter.
Assembly quality
Flux residue, solder balls and ionic contamination reduce surface insulation and can bridge creepage paths. Voids under large power packages raise junction temperature and speed fatigue. Whether a conformal coating or potting may be credited toward insulation depends on the standard and on qualifying the process — coverage, thickness, adhesion, bubbles; otherwise it is environmental protection, not insulation. Cleanliness testing, coating inspection and X-ray void inspection become safety-relevant process controls.
Thermal cycling
AI loads swing rack power between roughly 30% and 100% in milliseconds. That is electrical power cycling; it does not translate one-for-one into temperature cycling. Thermal mass in packages, copper planes, heat sinks and cold plates filters millisecond swings, so the board and solder joints see temperature changes only from load variation that persists long enough to move component temperatures — for example, workload phases, job starts and stops, and idle periods. How large and how frequent those thermal cycles are depends on the workload pattern and the cooling design, and has not been published for 800 VDC converters. Where sustained swings do occur, potential failure mechanisms to evaluate include solder fatigue under large packages, plated-through-hole barrel cracks in thick-copper boards, delamination at heavy-copper and thermal-interface layers, and ceramic capacitor cracking. Where a topology increases assembly interconnections per kilowatt, each joint must be more reliable to hold module reliability constant. Delamination near an isolation barrier is not only a reliability failure; it can become an insulation failure.
Production test access and qualification
Dielectric withstand (HiPot) and, for high-voltage magnetics, partial-discharge testing are used in the type qualification and production of isolated supplies; the product standard and qualification plan set which tests apply, and whether per type or per unit. At 2,000+ W/in³ there is little room for test points, coating can block in-circuit probes, and the test points themselves must respect creepage, so access must be designed in. Megawatt validation needs new capital equipment; Chroma, for example, markets a 1.8 MW bidirectional source/load for 800 VDC racks (Chroma, vendor product).
Qualification spans materials (tracking, CAF, humidity), assemblies (thermal and power cycling, humidity under bias) and systems. NVIDIA says equipment certification alone is insufficient and that initial validation limits will be set from simulation and data-center modeling (NVIDIA White Paper V2). For prefabricated Option C power blocks, factory acceptance testing moves much of the validation into suppliers’ plants.
A practical fabrication and qualification checklist
The checklist below is engineering practice drawn from the issues above, not a standards requirement. Applicable limits, test levels and sample sizes come from the governing product standard, the certification body, and the customer’s specification.
Table 4a — 800 VDC PCB fabrication and qualification checklist
| Area | What to check | Evidence to keep |
|---|---|---|
| Conductor geometry | Corner and pad-edge radii at high-voltage barriers; slot width and position; copper-to-board-edge and copper-to-hole distances on high-voltage nets; thick-copper etch compensation | Design-rule set tied to each insulation barrier; fabricator capability data used to set it |
| Finished insulation spacing | Creepage and clearance measured on finished boards at worst-case etch, plating and mask registration — not CAD nominal; inner-layer and planar-transformer prepreg thickness | First-article cross-sections and spacing measurements per barrier; lot-sampling plan |
| Laminate selection | Tracking performance (CTI / material group), CAF resistance, moisture absorption, dielectric strength, glass transition and Z-axis expansion matched to the design assumptions | Laminate datasheets, supplier qualification records, approved-material list with change control |
| Contamination control | Flux residue, ionic cleanliness, solder balls, handling contamination near high-voltage barriers; coating coverage, thickness, adhesion and bubbles where coating is used | Cleanliness test records; coating inspection results; documented basis for any insulation credit claimed for coating or potting |
| Solder-joint reliability | Voiding under large power packages and thermal pads; joint quality on stacked-stage devices; fillet and wetting on thick-copper pads | X-ray void inspection results; process windows; rework rules for high-voltage areas |
| Thermal and power cycling | Cycling profiles representative of AI load swings; barrel cracking in thick-copper vias; delamination near isolation barriers; capacitor cracking | Qualification test reports with failure analysis; cross-sections after cycling |
| HiPot and partial discharge | Which dielectric-withstand and partial-discharge tests the product standard requires, on which barriers, at type test vs every unit; PD under representative switching waveforms for high-voltage magnetics | Test plan mapped to each barrier; production test records |
| Production inspection and test access | Test points that respect creepage; probe access through coating; AOI/X-ray coverage of high-voltage areas; traceability of laminate lot, coating batch and test results to serial number | Inspection coverage map; traceability records |
For most teams the first useful step is the second row: measuring finished spacing on real boards against the design’s insulation assumptions, before reliability testing begins.
For fabricators and contract manufacturers, 800 VDC is not a new rating on an old product. It is a class of assembly in which fabrication tolerance, laminate selection and process cleanliness are part of the insulation system.
8. Voltages, connectors, busways, breakers and grounding
NVIDIA’s 2026 white paper spends far more pages on fault behavior, grounding and protection than on efficiency (NVIDIA White Paper V2). That emphasis shows where the remaining difficulty sits.
What “800 V” does and does not tell you
Nominal 800 VDC specifies only the first of four voltages that matter:
- Pole-to-pole: 800 V between positive and return; the stress across barriers between poles.
- Pole-to-earth: the stress between each conductor and grounded metal or people. With a midpoint reference (±400 V), each pole sits nominally about 400 V from earth; with the return referenced to earth, the positive conductor sits about 800 V from earth.
- Grounding configuration: NVIDIA is evaluating high-resistance midpoint grounding, high-resistance return grounding, floating and solid grounding, and has not chosen. In a floating system, a first ground fault pulls one pole toward earth potential and raises the other pole’s voltage to earth, which is why insulation monitoring becomes essential.
- Transient overvoltage: switching events, faults and surges coupled through the AC supply add short peaks above the steady value. Clearance is driven largely by this, which depends on circuit location and surge protection, not on the nominal voltage.
So nominal 800 VDC alone does not set insulation distances. The same converter can need different spacings depending on grounding, the barrier in question, overvoltage exposure, pollution degree and altitude. Until the grounding decision is made, designers cannot finalize pole-to-earth insulation with confidence.
Arcs, breakers and current limiting
DC has no current zero to help extinguish an arc. A series arc at a degraded connection can persist while drawing too little current to trip overcurrent protection, so NVIDIA calls for connector temperature monitoring and high-frequency signature sensing. In DC’s favor, converter-fed sources can be current-limited; NVIDIA requires current limiting at DC sources and recommends similar limiting for batteries, capacitors and other storage, though the benefit counts in arc-flash studies only if regulators accept it.
Day-one systems use molded-case breakers whose clearing time, NVIDIA says, may be up to about 20 ms depending on device selection and fault conditions, requiring redundancy or hold-up time downstream. NVIDIA’s white paper says solid-state breakers can isolate faults within sub-millisecond timeframes (NVIDIA White Paper V2). NVIDIA targets a 125 A air-cooled unit for in-rack shelves and a 1,250 A, likely liquid-cooled, unit for native racks, while acknowledging solid-state breakers are mature only at lower currents.
Connectors, busways and heat
The 125 A cable into the compute rack borrows from EV charging: a mechanical lock confirms engagement, then an enable signal closes an upstream contactor; release opens the contactor before unlocking, and a short pin de-energizes on any break. Connectors are never mated under load. This is NVIDIA’s design, not an industry requirement, and contact-resistance drift and mating-cycle data have not been published. Option B adds overhead 800 VDC busway with 125 A tap cans and 1,250 A feeders; Option C adds 6,000 A-class DC busduct.
Heat moves rather than disappears. At 600 kW output and 97.5% conversion efficiency, about 15 kW of conversion heat shifts to the power rack or gray space (our calculation: 600 × (1/0.975 − 1)). Option A’s extra 800 V-to-54 V stage adds roughly 12 kW back inside the compute rack at an assumed 98%.
9. Certification: product, installation, workplace
“Is 800 VDC certified?” is three questions. A product can be listed, an installation approved, and work on it done safely; each is governed by different documents and people.
Product certification
Two kinds of evidence are available here, and they should not be confused: published scope summaries from standards publishers, and statements about certification from NVIDIA and test laboratories. Neither is a certification decision. Those are made product by product, by a certification body applying the full standard text.
What the scope summaries say. The publisher summaries for IEC 62368-1, the safety standard most IT equipment is certified to, describe equipment “with a rated voltage not exceeding 600 V.” That wording appears in the scope of the withdrawn 2014 and 2018 IEC editions (IEC; AFNOR) and of EN IEC 62368-1:2024, which adopts the current IEC 62368-1:2023 edition without changes (EVS), and in the North American UL 62368-1 fourth edition published July 31, 2025 (ANSI/UL). A test laboratory reports that CSA began requiring the fourth edition for new Canadian certifications on April 30, 2026 (SIQ). None of these summaries says whether the limit applies to AC, DC or both, or how “rated voltage” applies to a product’s output or internal circuits. We did not review the full standard texts.
What has been said about certification. NVIDIA states that its first power rack can be certified now under UL 62368-1 for both UL and IEC regions (NVIDIA White Paper V2). The rack’s supply input is 415–480 VAC and its 800 VDC is an output; whether that is the basis of the claim has not been published. Separately, the Slovenian test laboratory SIQ has written that equipment with an 800 VDC rated input falls outside IEC 62368-1’s scope and points to IEC 62477-1 — a converter safety standard whose published scope extends to 1,500 VDC — as one alternative (SIQ, Jun 2026; IEC 62477-1 scope). That is one laboratory’s view, not a ruling. For 800 VDC-input equipment such as the compute rack’s DC/DC shelf, no certification route has been publicly confirmed in either direction; the answer will come from certification bodies’ interpretations of the full texts.
Protective hardware follows its own standards, and the same caution applies. The published scope of UL 489 (2025), for molded-case breakers, extends to 1,500 VDC and 6,000 A (ANSI/UL). The published scope of UL 857 Ed. 14 (2025), the busway standard, covers busways rated 1,000 V or less and 6,000 A or less (ANSI/UL); the summary does not say whether DC ratings are included. An 800 V rating now falls inside the stated voltage ceiling, but the summary alone does not establish whether or how 800 VDC busway will be listed. NVIDIA lists busway, connector and breaker qualification among its industry-engagement priorities (NVIDIA White Paper V2), and the OCP partners say they are working with UL Solutions, NFPA, IEEE and IEC on safety certification (OCP, Aug 2026). Two documents sometimes cited for 800 VDC, UL 489B and UL 98B, are scoped for photovoltaic systems (UL 489B; UL 98B), and UL 4128 covers battery intercell connectors, not rack power cables (UL 4128).
Installation approval and workplace safety
A listed product does not make an installation compliant. In North America the National Electrical Code and the local authority having jurisdiction govern the installed system; internationally, the IEC 60364 series does. Flex says neither the NEC nor OSHA “has taken on the advent of 800 VDC in the data center yet” (Flex); UL Solutions notes that existing requirements are rooted largely in experience with AC (UL Solutions).
NFPA 70E governs work on energized equipment. It contains a DC incident-energy method in an informative annex (EC&M); the 2024 edition’s DC arc-flash PPE-category table covers sources greater than 150 V up to 600 V, below 800 V, and first-revision records for the next edition keep that range (NFPA). IEEE 1584-2018, the main arc-flash calculation guide, is AC-only (IEEE SA), and the revision project approved in 2025 keeps DC out of scope (IEEE SA, P1584). UL Solutions says predicting DC arc-flash energy remains limited; Schneider Electric’s 2026 study, built on NFPA 70E methods, found 800 VDC arc-flash risk manageable and in many cases comparable to or lower than typical AC systems, while noting that no industry-wide guidance yet exists for converter-fed 800 VDC (Schneider). Neither has published field data from an operating 800 VDC hall.
Table 5 — Standards by category (published scope summaries)
| Category | Standard | Published scope (edition reviewed) | Open question for 800 VDC |
|---|---|---|---|
| Product | IEC/UL/CSA 62368-1 | Rated voltage ≤600 V (2014–2025) | Treatment of 800 V outputs and DC-input gear |
| Product | IEC 62477-1 | Converters ≤1,000 VAC / ≤1,500 VDC (2022) | North American acceptance |
| Product | UL 489 | MCCBs ≤1,500 VDC, ≤6,000 A (2025) | Ratings for converter-fed DC faults |
| Product | UL 857 | Busways ≤1,000 V, ≤6,000 A (2025); AC/DC not stated | DC rating and listing route for 800 VDC busway |
| Basic safety | IEC 60664-1 | Insulation coordination ≤1,500 VDC, ≤30 kHz (2020; scope unchanged in 2020+AMD1:2025) | Fit with MHz-switching converters; IEC 60664-4 covers >30 kHz to 10 MHz but is scoped to ≤1,000 VAC equipment |
| Installation | NEC; IEC 60364 | Installation rules | No 800 VDC data-center provisions identified |
| Workplace | NFPA 70E | Electrical safety at work (2024) | DC methods above 600 V |
| Calculation | IEEE 1584 | Three-phase AC arc flash | No DC method |
10. The alternatives are not standing still
800 VDC is one answer to rising rack power, and its competitors are improving in parallel.
Higher-performance AC. NVIDIA’s White Paper V2 describes its DSX reference design with 480 VAC distribution “from utility interconnection through the compute rack” (NVIDIA White Paper V2), while the October 2026 DSX POD specifies a standard 800 VDC container input (NVIDIA Technical Blog). NVIDIA is offering both. Best-practice AC — 415 or 480 VAC to the rack, high-efficiency power shelves, eco-mode UPS — is the baseline every DC efficiency claim should be measured against, and as Section 5 showed, it narrows the native DC advantage to a few points.
Liquid-cooled 54 V. NVIDIA keeps 54 V in-rack distribution through its next generation, reaching up to 570 kW per rack position with liquid-cooled shelves, busbars and connectors (NVIDIA White Paper V2) — approaching the ~660 kW TrendForce expects for Rubin Ultra racks (TrendForce).
±400 VDC (Mt Diablo). Meta, Microsoft and Google co-authored the Mt Diablo ±400 VDC sidecar power-rack specification through OCP, for 100 kW to 1 MW racks (OCP); Google chose 400 V to reuse the EV supply chain (The Register, May 2025). Pole-to-pole it is the same 800 V; it differs in pole-to-earth voltage and grounding. OCP now accommodates both, so these specifications are converging, not competing.
380 VDC. More than a decade ago, ETSI standardized a DC interface of up to 400 V for telecom and datacom equipment (ETSI EN 300 132-3-1, 2012), and the EMerge Alliance announced a 380 VDC Data/Telecom Center Standard, as reported in the trade press (EE Power, Nov 2012). Yet 380 VDC saw limited data-center adoption; Schneider Electric argued that best-practice AC had closed most of the efficiency gap (Schneider, 2013). A DC architecture can be sound and still stay a niche when the incumbent improves.
NVIDIA, Google, Microsoft and OCP all describe 800 VDC as an option alongside AC, deployed first where density is highest. Nothing in the published evidence supports calling it an inevitable universal standard.
11. What it means for your job
The engineering burden lands differently on each discipline. The actions below are practical engineering recommendations drawn from the evidence above, not standards requirements.
Table 6 — Role implications
| Role | What changes | What to do now |
|---|---|---|
| PCB designers | 800 V primaries share boards with high-current secondaries; creepage competes with 2,000+ W/in³ density; coating and laminate become part of the insulation system | Fix the insulation coordination scheme from the governing product standard before layout; select laminate tracking and CAF performance early; design rules on worst-case finished dimensions; plan HiPot and partial-discharge test access |
| Power electronics engineers | Stacked and input-series topologies, voltage balancing, high-ratio transformers; source current-limiting becomes part of the protection scheme | Design fast shutdown and fault-current limiting into every source; publish weighted efficiency across the load range, not only peak; qualify magnetics for partial discharge under real switching waveforms |
| Equipment manufacturers | Certification routes for 800 V-input IT equipment and 800 VDC busways are still being worked out; megawatt-scale validation is needed | Engage certification bodies early on the route (62368-1 vs 62477-1 or other); budget for megawatt test capacity; prepare factory acceptance testing for prefabricated power blocks |
| Data-center infrastructure teams | AC and DC will coexist; grounding, arc-flash method and AHJ acceptance are unresolved | Start with sidecar pilots where density demands it; require converter-aware DC arc-flash studies; train staff on DC work practices; keep an AC upgrade path open |
For contract manufacturers and PCB fabricators in particular, the opportunity and the risk are the same thing: 800 VDC converters reward suppliers who can hold tight spacing tolerances, document laminate and cleanliness performance, and support partial-discharge and HiPot testing at volume.
12. What to watch, and the verdict
Status as of October 21, 2026, separating announcements, reference-design readiness, expected deliveries, confirmed shipments and operating deployments:
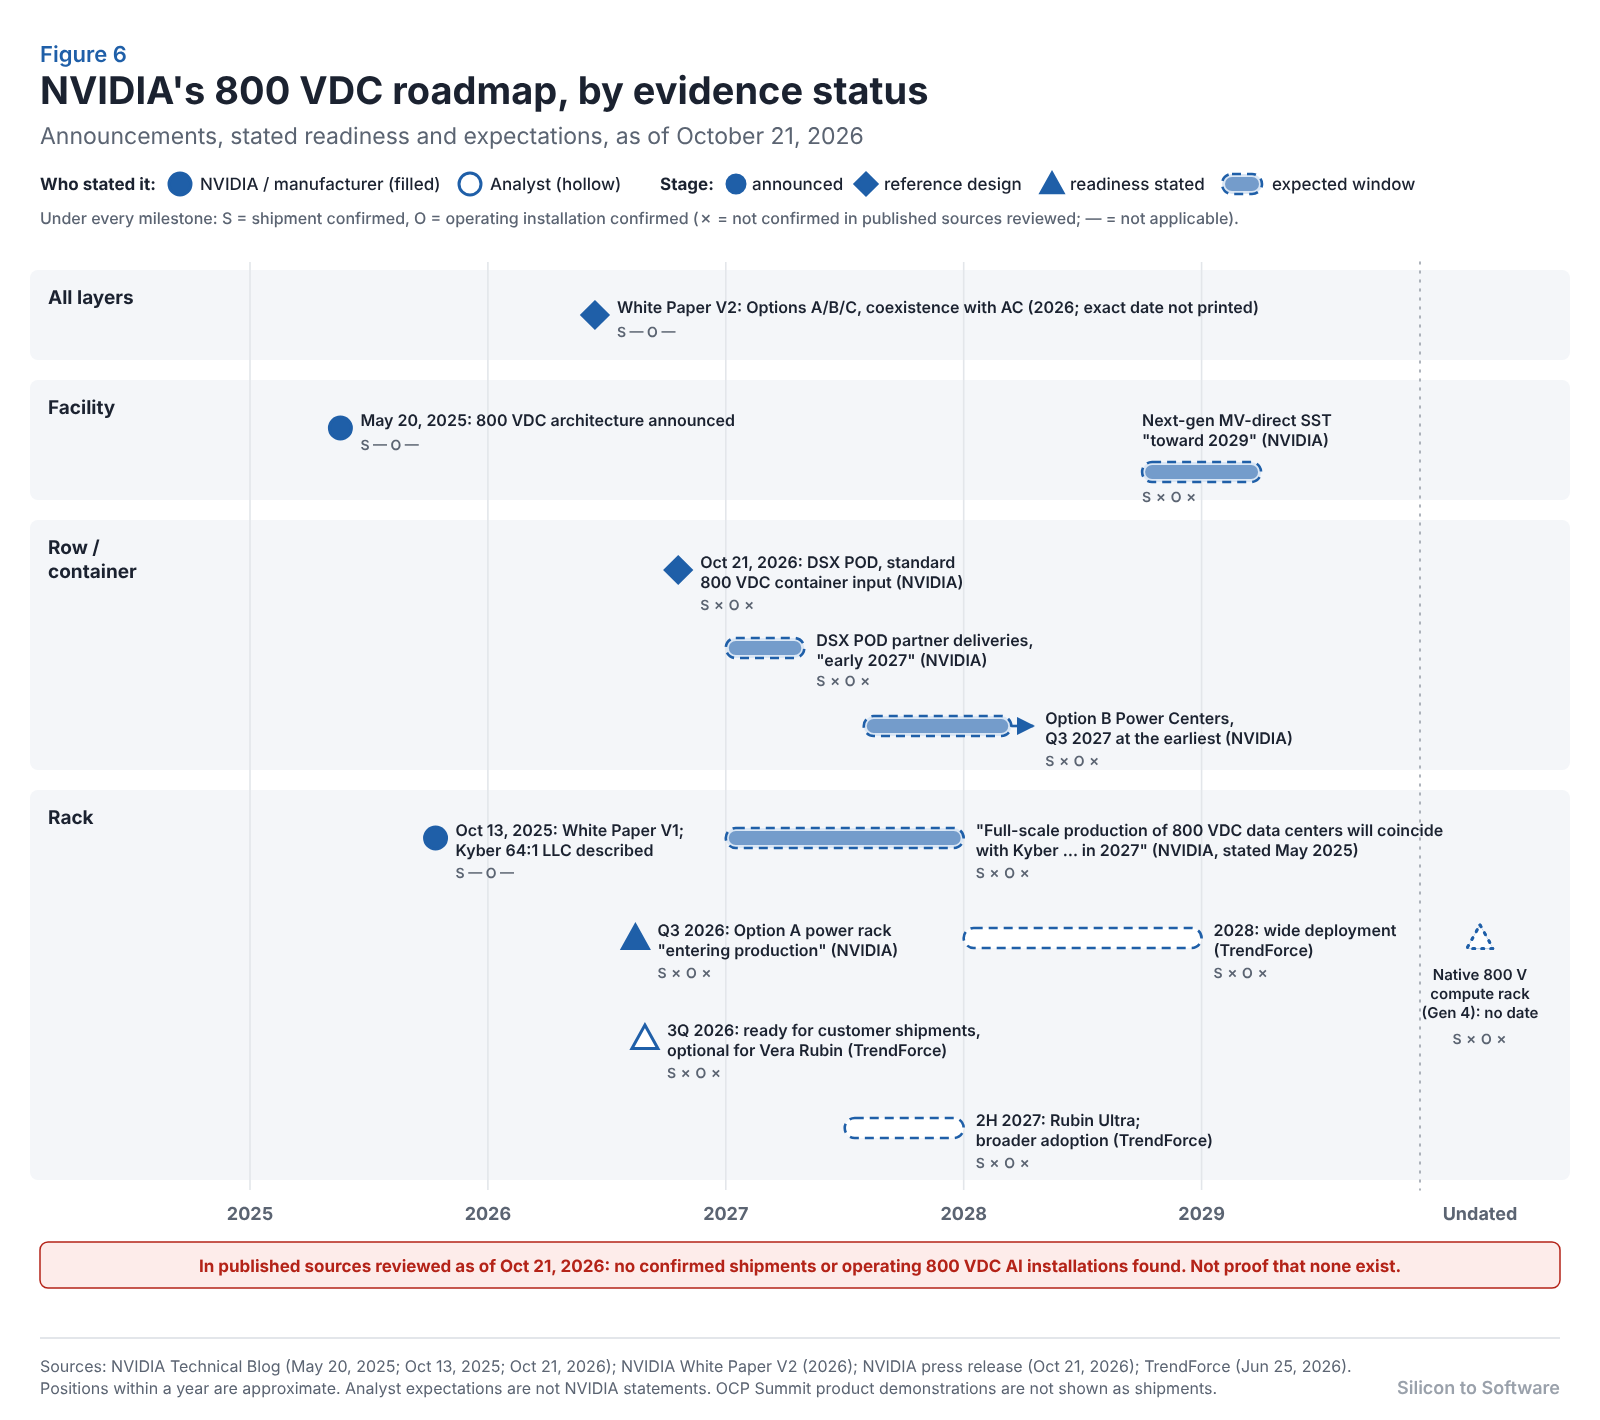
- 2H 2026 — Power racks (Option A): production slated for Q3 2026 (NVIDIA White Paper V2); customer shipments expected 3Q26 as an optional Vera Rubin configuration (TrendForce). At the October 2026 OCP Global Summit, Dell’Oro saw 800 VDC sidecars and power racks from several vendors but cited no operational deployment (Dell’Oro). Shipments and operating sites were not confirmed in the sources we reviewed.
- Oct 21, 2026 — DSX POD announced (announcement; reference design): NVIDIA introduced containerized Vera Rubin NVL72 AI factories with a standard 800 VDC input at the container boundary (NVIDIA Technical Blog). Shipments, operating installations and measured efficiency were not part of the announcement.
- Early 2027 — DSX POD partner deliveries (expected): NVIDIA’s stated timing for delivering DSX POD AI factories worldwide with its partners (NVIDIA press release). Not yet a confirmed shipment.
- Q3 2027 at the earliest — Row-level Power Centers (Option B): NVIDIA’s stated target, with OEMs preparing for pilots (NVIDIA White Paper V2).
- 2H 2027 — Rubin Ultra: analyst-reported; TrendForce expects broader adoption from here and wide deployment in 2028 (TrendForce).
- ~2029 — Medium-voltage SST power blocks: NVIDIA’s “toward 2029” target for next-generation SSTs (NVIDIA White Paper V2).
Worth tracking: the first independently measured efficiency from an operating hall; a grounding decision; a production 1,250 A solid-state breaker; a published certification route for 800 VDC busway and 800 V-input IT gear; and a dated native 800 V rack.
The verdict. Against a 54 V in-rack bus, the physics is decisive; megawatt racks need higher voltage somewhere. Against modern 480 VAC, the advantage is real but moderate, and NVIDIA’s headline copper and efficiency figures need careful reading.
800 VDC does not make the power problem disappear. It moves it — out of the rack busbar and into converters, insulation systems, connectors, breakers, busways, grounding schemes and qualification programs that must now be engineered, certified and manufactured at scale. The 2026 hardware still converts to 54 V inside the rack, and the native rack has no date. How fast the transition happens now depends less on NVIDIA than on the fabricators, module makers, breaker manufacturers, certification bodies and facility teams that inherit the work.
About the Author
Imran Valiani | Sales Director, PCB Electronics Manufacturing
20+ years working with major Bay Area and global tech clients. Founder of Silicon to Software, where I write about the hardware layer — PCB fab, AI gear, autonomous systems, and cyber — the stuff most tech writers have never touched. Literally.
Follow: X @SiToSoftware | LinkedIn
This article was developed with AI assistance and edited, fact-checked, and reviewed by the author. See my full AI disclosure.
Listen to the Silicon to Software podcast on Apple Podcasts, Spotify, or RSS.com — and watch on YouTube.
Sources
NVIDIA and OCP (primary)
- NVIDIA Technical Blog, NVIDIA 800 VDC Architecture Will Power the Next Generation of AI Factories, May 20, 2025
- NVIDIA Technical Blog, Building the 800 VDC Ecosystem for Efficient, Scalable AI Factories, Oct 13, 2025
- NVIDIA Blog, Gigawatt AI factories at OCP, Oct 2025
- NVIDIA, 800 VDC Architecture: Industry Alignment & Execution (White Paper V2), 2026
- NVIDIA Blog, Why Scaling AI Compute Performance Requires a New Power Architecture, Aug 11, 2026
- NVIDIA Newsroom, NVIDIA Introduces DSX POD AI Factories to Accelerate Europe’s Infrastructure Deployment, Oct 21, 2026
- NVIDIA Technical Blog, Achieve Productive AI Capacity Faster and More Predictably with NVIDIA DSX POD, Oct 21, 2026
- OCP, How Google, Microsoft and NVIDIA Are Standardizing the Transition to LVDC, Aug 11, 2026
- OCP, Mt Diablo and APAC Summit contributions, 2025
Standards (publisher scope pages)
- IEC 62368-1:2014 (withdrawn); IEC 62368-1:2023 (AFNOR listing); EN IEC 62368-1:2024; UL 62368-1 Ed. 4-2025; UL/CSA 4th edition transition (SIQ)
- IEC 62477-1:2022; IEC 60664-1:2020; IEC 60664-1:2020+AMD1:2025; IEC 60664-4:2005; IEC 60364-1:2025
- UL 489 Ed. 14-2025; UL 857 Ed. 14-2025; UL 489B; UL 98B (In Compliance); UL 4128
- IEEE 1584-2018 (IEEE SA); NFPA 70E first-revision records; EC&M on NFPA 70E Annex D
- SIQ, Scope Limitations of IEC 62368-1 for 800 V DC, Jun 2026
- ETSI EN 300 132-3-1 V2.1.1 (DC interface up to 400 V for ICT equipment), Feb 2012
Research, trade and analyst
- Shrestha et al., Efficiency and Reliability Analyses of AC and 380 V DC Distribution in Data Centers, IEEE Access, 2018
- Power stabilization for AI training data centers (NVIDIA, Microsoft, OpenAI), 2025
- Power Electronics News, Nvidia GTC 2026: 800 VDC Power Partnerships From Grid to Processor, Mar 19, 2026
- Wolfspeed, Powering AI with Reliable SiC-Based Solid-State Transformers, Mar 2026
- TrendForce, NVIDIA’s 800V Power Rack to Debut as an Optional Configuration for Vera Rubin, Jun 25, 2026
- Dell’Oro Group, Inside OCP Global Summit 2026, Oct 19, 2026
- Schneider Electric, DC arc flash analysis for 800 VDC AI data centers, Aug 20, 2026; AC vs DC efficiency white paper; AC/DC blog, 2013
- UL Solutions, Powering the AI boom without losing sight of electrical safety; Flex, Higher voltage, higher stakes
- California Energy Commission / LBNL, DC Power Distribution Cuts Data Center Energy Use, PIER brief CEC-500-2008-042, Oct 2008
- IEEE Electrification Magazine, 380 Vdc in data centers, Jun 2016
- The Register, Google details plans for 1 MW IT racks, May 1, 2025
- Eltek, Flatpack2 DC/DC 380/48 3000 SHE product page; Navitas, 800 V–6 V power delivery board release (GlobeNewswire, Mar 16, 2026); Semiconductor Today, Infineon CoolGaN HV IBC reference designs, Mar 18, 2026; Chroma, 1.8 MW bidirectional supply
- The New Stack, NVIDIA DSX POD containers, Oct 21, 2026
- STMicroelectronics, 800 V HVDC data center power (ST blog), Jun 13, 2025, updated 2026
- EPC, 800 VDC to 12.5 V converter white paper
- Texas Instruments, 800 VDC power architecture release (via StockTitan), Mar 16, 2026
- Power Electronics News, Infineon Unveils 800-V CoolGaN HV IBC Reference Designs, Mar 18, 2026
- EE Power, EMerge Alliance completes new Data/Telecom Center 380 VDC power standard, Nov 12, 2012