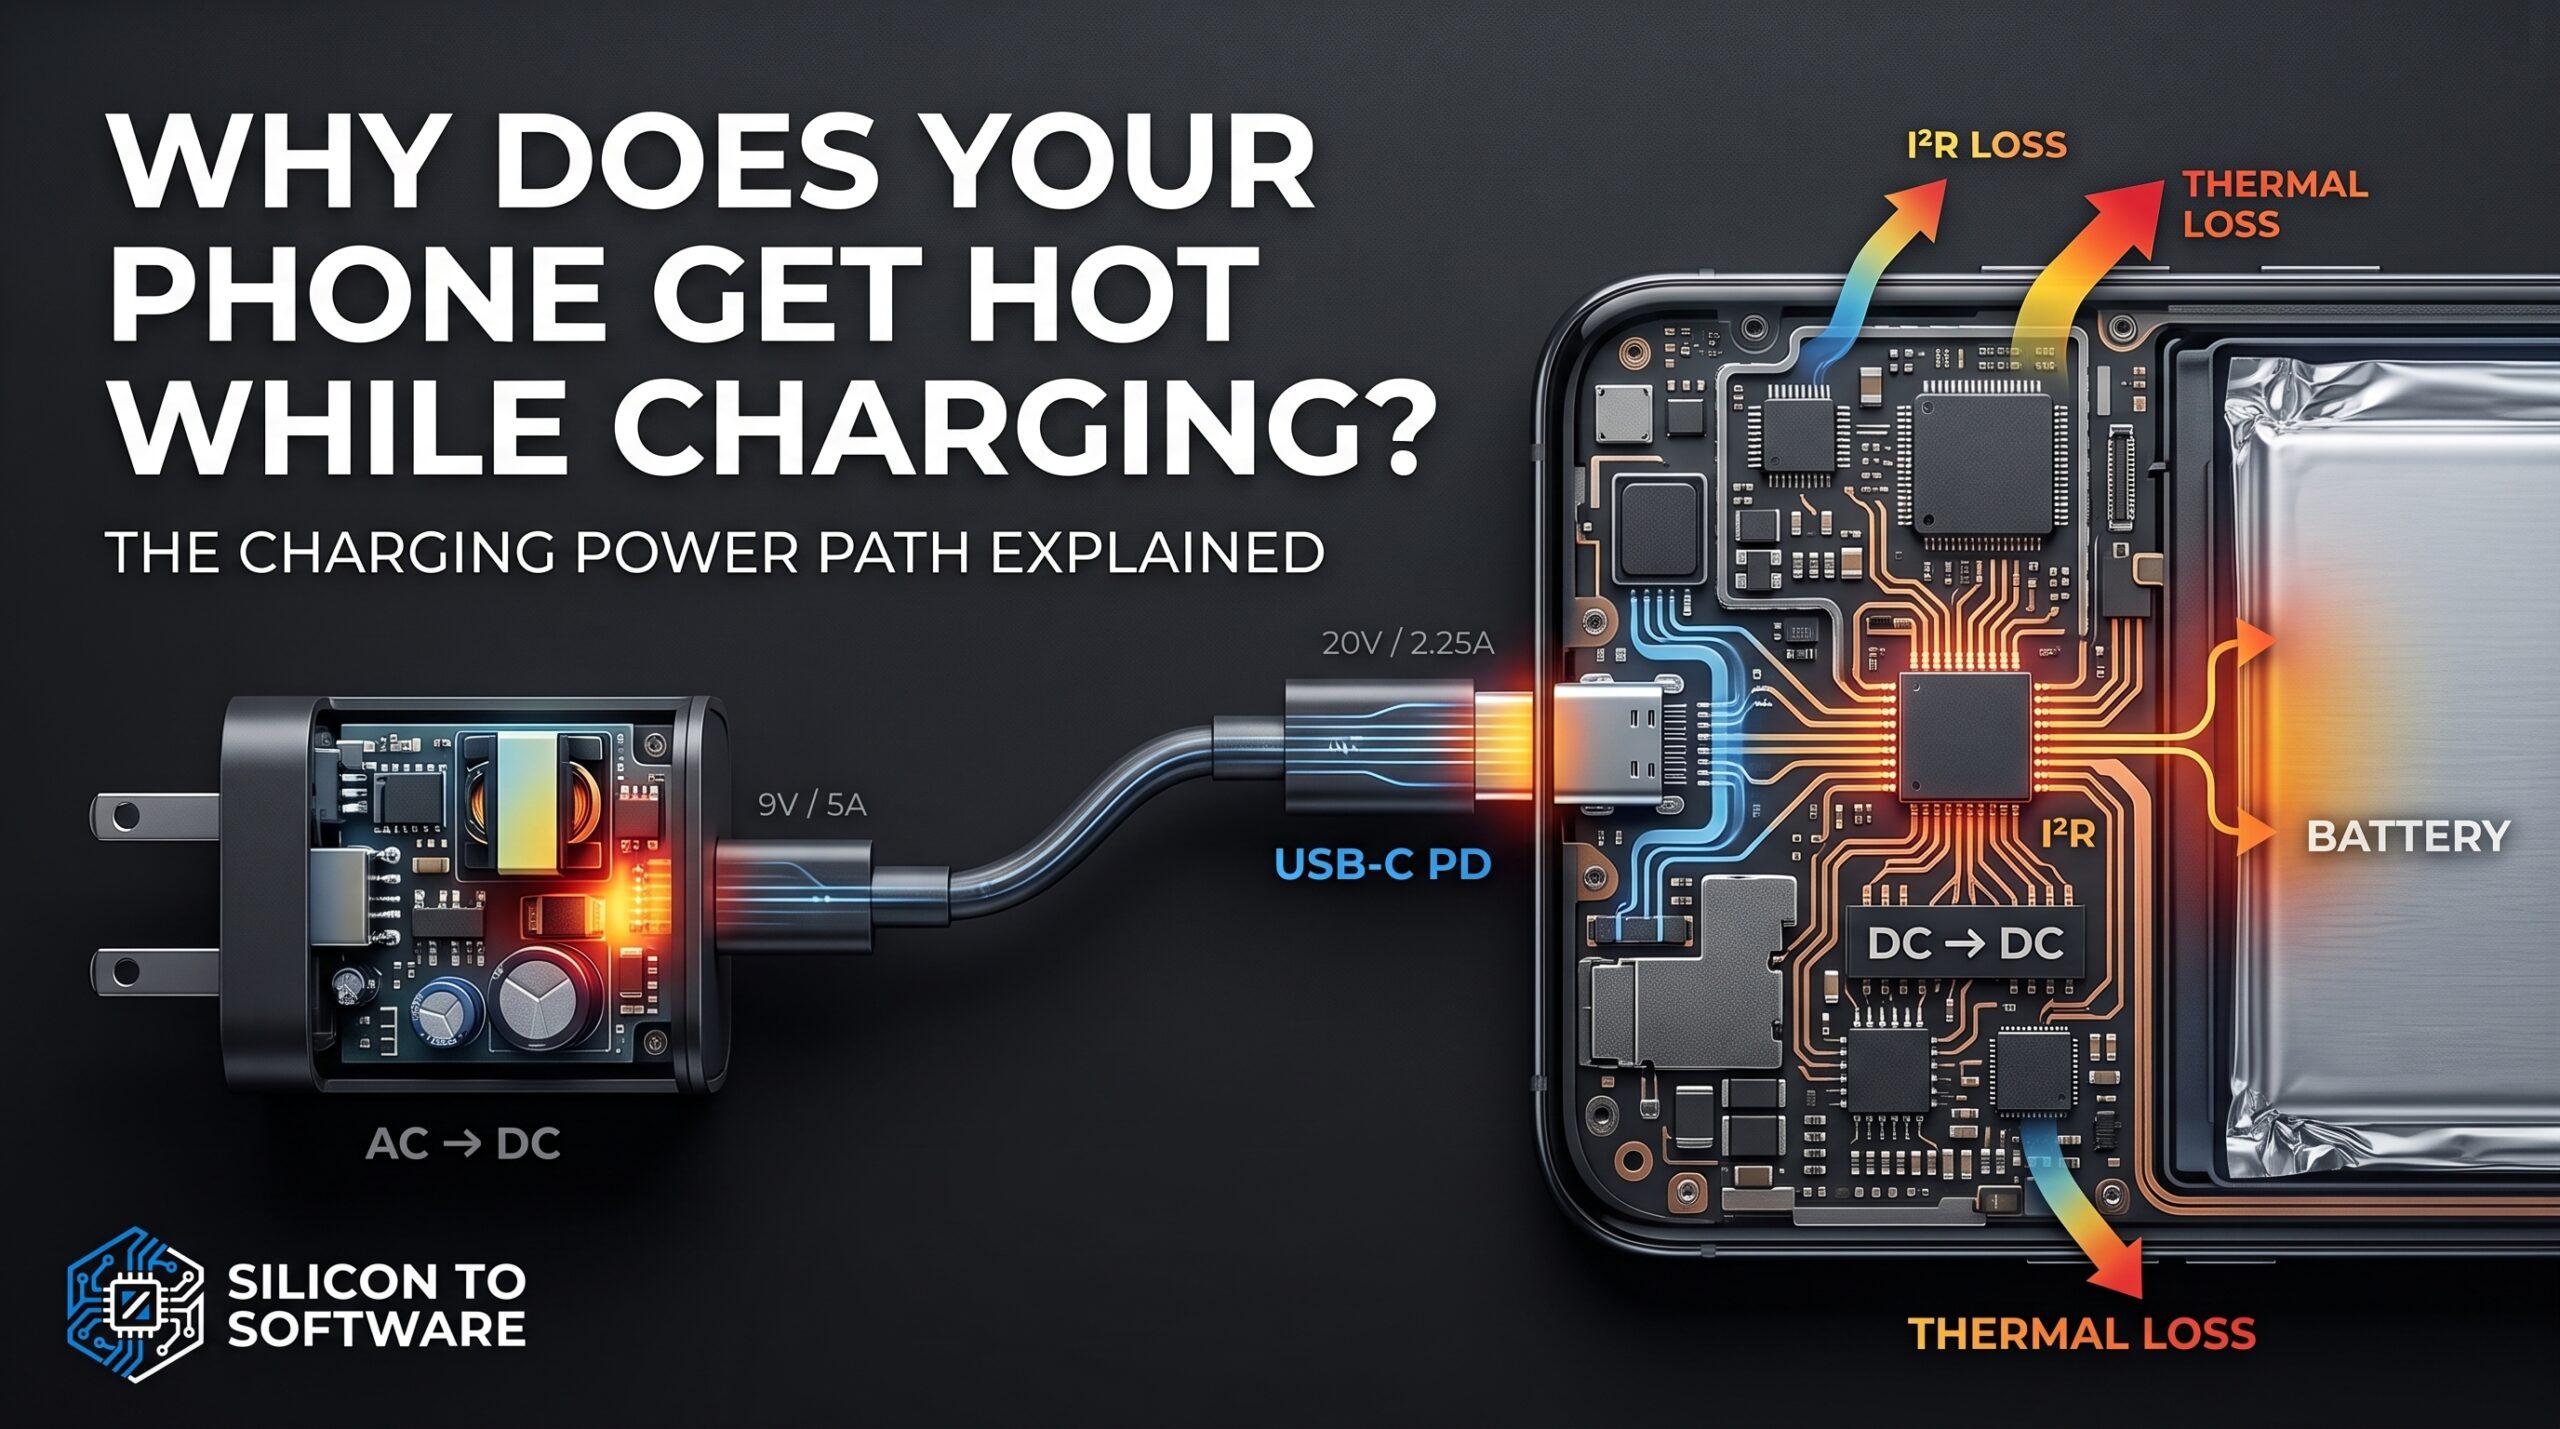
Why Does Your Phone Get Hot While Charging? The Charging Power Path Explained
A stage-by-stage engineering breakdown of AC-DC conversion, USB-C PD negotiation, charger-IC efficiency, and battery internal resistance — and why a charger’s wattage rating tells you almost nothing about how hot your phone will get.
Table of Contents
Why does your phone get hot while charging? Plug it into a fast charger and hold it for ten minutes, and you’ll feel most of the answer yourself. It gets warm — sometimes uncomfortably so. Most people read that warmth as one thing: the battery working hard. That reading is incomplete in a way that matters if you actually design or spec power electronics for a living.
By the time energy reaches the cell, it has already passed through several lossy elements on its way there — true energy conversions, resistive transmission loss, and a negotiated voltage/current contract that sets the terms for everything downstream. Not all of those are the same kind of thing, and it’s worth being precise about which is which. The heat you feel on the case is a sum across that whole path, not a single event. And the constraint that actually limits how fast a phone can charge isn’t the charger’s wattage rating alone — it’s inseparable from the internal resistance of the cell itself, which interacts with electrode kinetics, lithium-plating risk, and voltage limits in ways that shift with temperature, state of charge, and age.
This article walks that path stage by stage: AC-DC rectification in the wall adapter, resistive loss in the cable, USB-C Power Delivery (PD) voltage negotiation, charger-IC step-down inside the phone, and finally the battery’s own charge-acceptance behavior. At each stage, I’ve pulled real datasheet and peer-reviewed numbers rather than repeating the unsourced efficiency percentages that circulate in consumer tech coverage. Where the public record doesn’t have an answer, I’ve said so directly instead of estimating.
I’ve spent 20-plus years on the technical sales side of PCB manufacturing, which means I’ve sat through more DFM reviews over trace width and current-carrying capacity than I’d like to admit. That background is useful here mainly because it means I know where the datasheets live and how to read them — this isn’t a lab study; it’s a synthesis of the primary sources that actually document each stage of this chain.
Why 0°C to 45°C Isn’t a Hard Limit
Peer-reviewed materials research describes the accepted operating envelope for lithium-ion cells as roughly 0°C to 45°C for charging and −20°C to 55°C for discharging. In practice, that envelope isn’t a switch — it’s a graduated derating curve, and it’s more granular than a single “0 to 45” range suggests. Texas Instruments’ own JEITA-compliant charger datasheet (the bq2405x family) documents four explicit thresholds: normal charging from 10°C to 45°C, charge current cut in half between 0°C and 10°C, charge regulation voltage reduced between 45°C and 60°C, and charging disabled entirely below 0°C or above 60°C. This guidance was published jointly by the Japan Electronics and Information Technology Industries Association and the Battery Association of Japan in 2007, and JEITA-style profiles like this one are implemented in commercial charger ICs across the industry — it’s a voluntary framework, not a regulatory mandate, and individual phone manufacturers layer their own specific operating limits on top of it. Apple’s iPhone guidance, for instance, recommends charging in ambient environments between 0°C and 35°C — narrower than the cell-level envelope — and iOS will automatically slow or pause charging outside that range, resuming once temperature normalizes. It’s a graduated system, not an on/off switch, and that’s the framework every stage downstream has to operate inside.
Why Does Your Phone Get Hot While Charging? The Power Path Explained
Energy destined for a phone’s battery passes through five links, though it’s worth being precise that not all of them are actually energy conversions:
- AC-DC conversion in the wall adapter — a true conversion stage, turning grid AC into regulated DC
- Cable and connector transmission — not a conversion, but a resistive transmission path where I²R loss occurs
- USB-C PD negotiation — not a conversion either; it’s a protocol exchange that sets the voltage/current contract between charger and phone before meaningful current flows, and has no power-loss curve of its own the way the surrounding hardware does
- Charger-IC/DC-DC conversion inside the phone — a second true conversion stage, commonly grouped with the broader power management IC (PMIC), though charging is frequently handled by a dedicated charger IC distinct from the PMIC proper
- Battery charge acceptance — governed by the cell’s own internal resistance and electrochemistry, not a conversion in the power-electronics sense at all
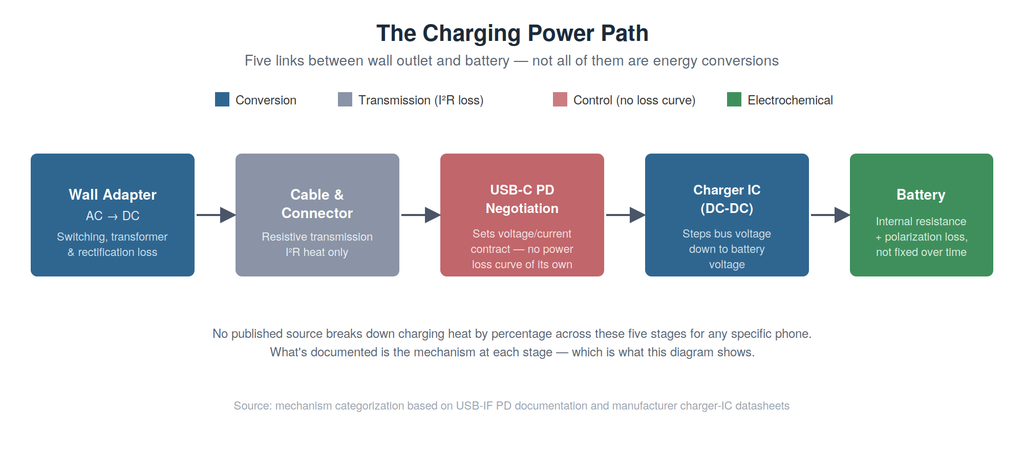
I could not locate a manufacturer, teardown lab, or peer-reviewed study that has published a percentage breakdown of charging heat by stage for any specific current-generation phone. That’s worth stating plainly. What follows is the documented mechanism at each stage, ranked by evidence strength: manufacturer datasheets and application notes carry the most direct authority; peer-reviewed journal articles come next; peer-reviewed conference proceedings (a lighter-review tier) support the mechanism-level claims; everything else is flagged as inference.
AC-DC Conversion: The Wall Adapter
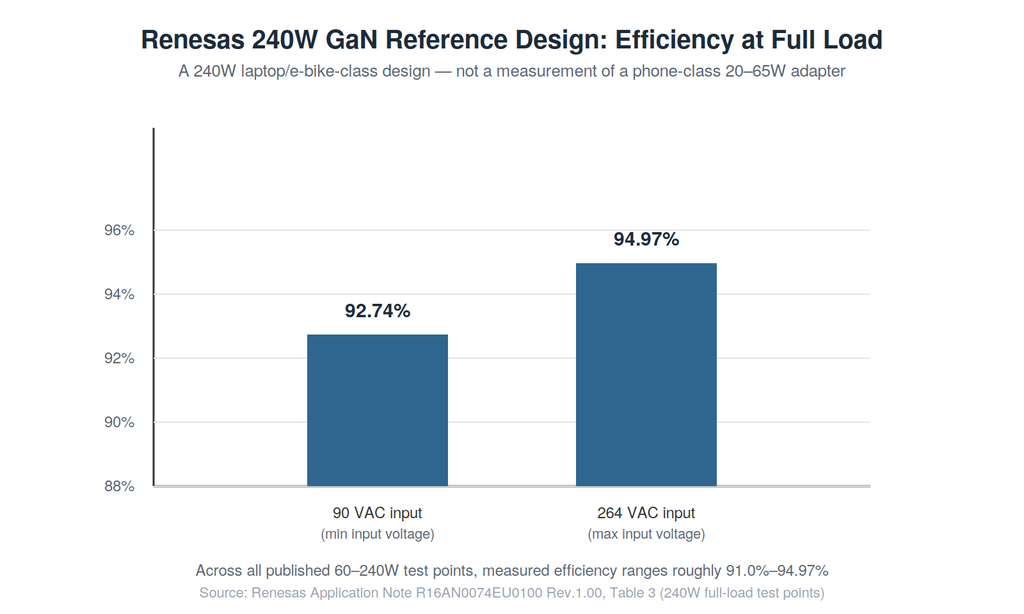
A Renesas application note for a 240W USB-C PD 3.1 Extended Power Range (EPR) reference design — built around GaN power switches — publishes real measured efficiency data rather than a marketing figure. Across the design’s published 60–240W test points, measured conversion efficiency ranges from roughly 91.0% to 94.97%. At the 240W full-load point specifically, it ranges from 92.74% at 90VAC input to 94.97% at 264VAC input.
This is a 240W design intended for laptops, e-bikes, and power tools. It demonstrates what this GaN topology is capable of at scale — it is not a measurement of what a phone-class 20–65W adapter actually delivers. Adapter efficiency depends heavily on topology, semiconductor choice, switching frequency, and operating point, not on wattage or physical size alone, so this figure should not be transferred directly onto a smaller charger. It remains the best publicly documented primary-source efficiency data available at this stage of the chain, with that scope caveat attached.
The mechanism: switching losses in the power transistors, core losses in the transformer, and conduction losses in the rectification path all convert a slice of input power into heat rather than output power. GaN’s role here is a switching-physics one — this topology runs Zero Voltage Switching with GaN HEMT devices, whose switching characteristics enable high-frequency, high-power-density designs with lower switching loss than a comparable silicon-MOSFET implementation. It’s a reasonable engineering inference — though not one I have a direct silicon-vs-GaN head-to-head measurement to confirm, despite searching for one — that this is part of why modern high-wattage chargers run smaller and cooler than their predecessors at equivalent output.
Trade-off: GaN devices and their associated digital control add bill-of-materials cost a simpler silicon design avoids. Not every 65W or 100W charger on the market is built to the same efficiency standard, and the gap shows up as heat in your hand.
Cable, Connector, and PD Negotiation: Why Wattage Isn’t Heat
This is where consumer coverage most often gets the physics backward. Resistive heat in a conductor follows I²R — current squared times resistance — not power directly. That relationship is the entire reason USB-C PD negotiates voltage instead of simply raising current. Scaled up to a megawatt AI rack, the same I²R logic drives NVIDIA’s shift to 800V DC power.
USB-IF, the standards body itself, confirms that PD 3.1 introduced Extended Power Range (EPR), adding fixed voltages of 28V, 36V, and 48V that enable 140W, 180W, and 240W power levels, respectively — and that prior to this update, USB PD was limited to 100W using a solution based on 20V at 5A. As of 2026, USB-IF’s current published specification is USB Power Delivery Revision 3.2, Version 1.2 — independent technical reporting describes this revision as primarily a terminology-alignment update, and the EPR voltage tiers introduced with PD 3.1 remain the relevant framework for 140W, 180W, and 240W operation. The full specification progression runs from 5V at PD 1.0 through the Standard Power Range (SPR) fixed voltages of 5V/9V/15V/20V, with EPR adding the higher tiers on top; PPS operation within SPR uses a programmable voltage range rather than a single additional fixed tier. It’s worth being direct about this: phones don’t use the 48V EPR tier. EPR governs the 100W-to-240W range aimed at laptops and high-power devices, while phone fast charging operates within the SPR range, typically negotiating voltages via Programmable Power Supply (PPS) up to 20V and currents up to 5A.
Raising voltage instead of current is straight Ohm’s law: for a fixed power target, higher voltage means lower current, and since resistive heating scales with current squared, even a modest voltage increase produces a meaningful heat reduction in the cable and connector. A simple illustrative calculation, using voltages actually relevant to phone charging, makes the scale of this clear. Assume a hypothetical fixed cable-loop resistance of 0.1Ω (an assumed value for illustration, not a measured cable spec) carrying 45W of power at two standard SPR voltage steps:
- At 9V / 5A: resistive loss = I²R = 5² × 0.1Ω = 2.5W
- At 20V / 2.25A: resistive loss = I²R = 2.25² × 0.1Ω ≈ 0.51W
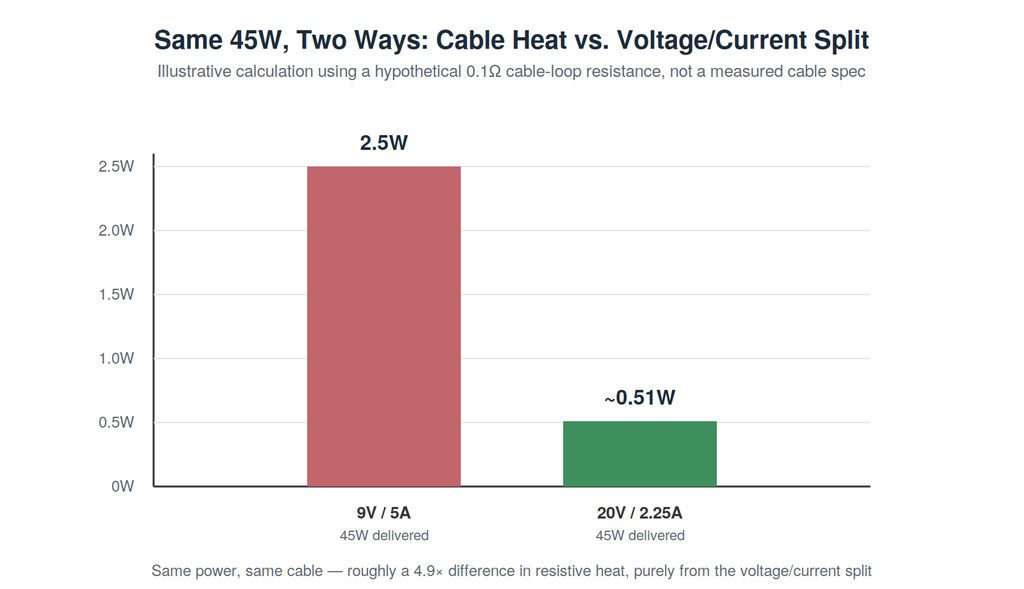
Same power delivered, same cable, roughly a 4.9× difference in resistive heat — purely from the voltage/current split, using two voltage steps a phone can actually negotiate over standard USB-PD. That’s the practical engineering argument for negotiating higher voltage within a phone’s normal charging range, and it’s why the actual current a cable is carrying matters more to heat generation than the wattage number printed on the charger. The same current-squared relationship, at a scale measured in megawatts rather than watts, is why EV fast-charging architectures have pushed toward 800V and 1,000V systems — see Silicon Carbide EV Charging Explained for how that plays out when the cable has to carry 1,000 amps instead of 5. It’s the same physics straining the 1,400-amp busbars inside AI server racks, too — see AI Cooling Is the Next Bottleneck for how that shows up at data-center scale.
It’s also worth separating standard USB-PD charging from the vendor-proprietary fast-charging systems some manufacturers use instead of or alongside it. Xiaomi’s 120W HyperCharge, for instance, requires a dedicated 6A-rated cable and proprietary negotiation — a different architecture from standard USB-PD’s 5A current ceiling. The USB-PD voltage-negotiation story explains a large share of phone fast charging, but not every high-wattage phone charging system works this way.
Practical consequence: cable quality is not cosmetic. A thinner-gauge or poorly-terminated USB-C cable has higher resistance per unit length than the illustration above assumes, and at fast-charging current levels, that resistance becomes measurable I²R heating at the connector — independent of anything happening in the battery.
Charger-IC Conversion: The Hidden Stage
Negotiating a higher bus voltage reduces cable heat, but it shifts more conversion burden onto the phone’s charger IC, which has to step that voltage down to whatever the battery pack requires. No phone manufacturer publishes the exact efficiency curve for the specific charger IC inside a specific model, but datasheets for the component class give a representative sense of where this stage sits. TI’s BQ25790/BQ25792 buck-boost chargers are rated up to 97% efficiency — a peak figure under specific, favorable operating conditions rather than a constant across the full charge cycle, since real input voltage and battery voltage both shift as charging progresses. TI’s BQ25910 three-level buck charger reaches 95.4% efficiency at 1.5A from a 5V input but drops to 93.3% at 3A from a 9V input — note that both current and input voltage changed between those two points, so it isn’t a clean single-variable comparison. SGMicro’s SGM41578 buck-boost charger offers a cleaner same-voltage comparison: 95% at 1A but only 92.5% at 2A under otherwise identical conditions, showing efficiency falling as conduction losses — which scale roughly with current squared — become increasingly important as current rises.
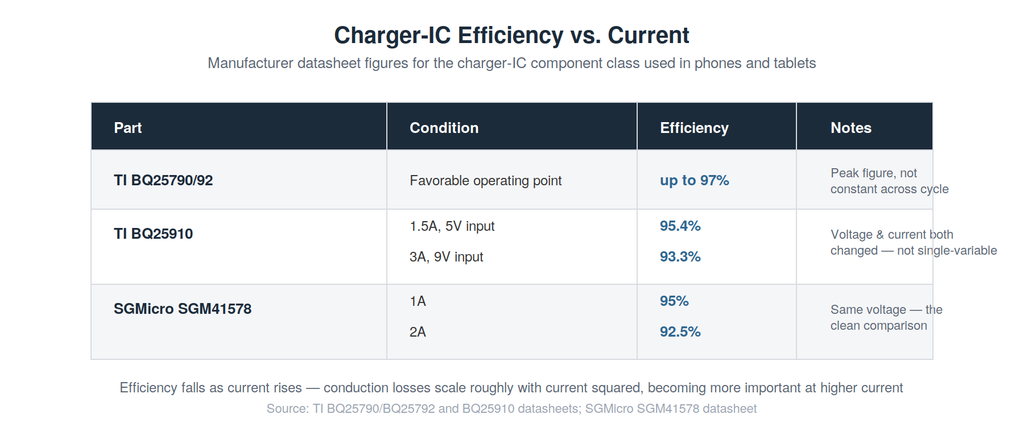
Converter efficiency isn’t always monotonic with current across its full operating range; many switching converters actually peak at a mid-load point, since fixed switching and control losses matter more at light load while conduction losses dominate at heavy load. But within the current ranges phones actually use for fast charging, rising conduction loss at higher current is a well-documented effect, and it’s the same current-squared relationship driving heat at every other stage in this chain. The charger IC isn’t exempt from this physics. It just hides the effect inside a sealed enclosure instead of an exposed cable.
Battery Charge Acceptance: The One Variable That Moves Unpredictably
The battery generates heat through two categories of mechanism: irreversible heat from its own DC internal resistance and from electrochemical polarization and charge-transfer losses at the electrode surfaces, and reversible heat from the entropy of the electrochemical reaction itself. Fixating on the battery as if it were self-evidently the dominant heat source in this chain isn’t something the evidence supports either way — no published source has measured the relative contribution of each stage for any specific phone, so I won’t claim the battery is or isn’t the primary source. What the evidence does support is a more specific and more useful point: the battery’s internal resistance is not fixed.
Internal resistance reaches its minimum in roughly the 20°C to 40°C range — the optimum operating window for a lithium-ion cell — and rises outside it, per a peer-reviewed modeling study published in Jurnal Mekanikal (2017) and a peer-reviewed conference paper (Yue et al., J. Phys.: Conf. Ser., 2022) confirming that ohmic internal resistance increases substantially as temperature drops, becoming severe at extremes. It’s worth being precise about what that second study actually measured: it’s a millisecond pulse-discharge characterization — a discharge study, not a charging study — of LTO, LFP, and NCR cells intended for high-power pulse-driver applications, not consumer smartphone charging. Both sources study automotive and industrial lithium-ion cells, not smartphone-specific pouch cells. The underlying electrochemical mechanism is chemistry-general, and there’s no reason to expect it doesn’t apply to phone cells, but a phone-specific measurement would be the stronger citation if one becomes available.
For a cold phone charged at a fixed current, the consequence is direct: I²R heating rises as resistance rises. In practice, though, phones don’t usually let that play out at constant current. JEITA-style profiles specifically cut charge current when the cell is cold — TI’s bq2405x datasheet documents current cut in half between 0°C and 10°C — precisely to limit this effect, so a cold phone in real use often ends up drawing less current rather than generating dramatically more heat at the same rate.
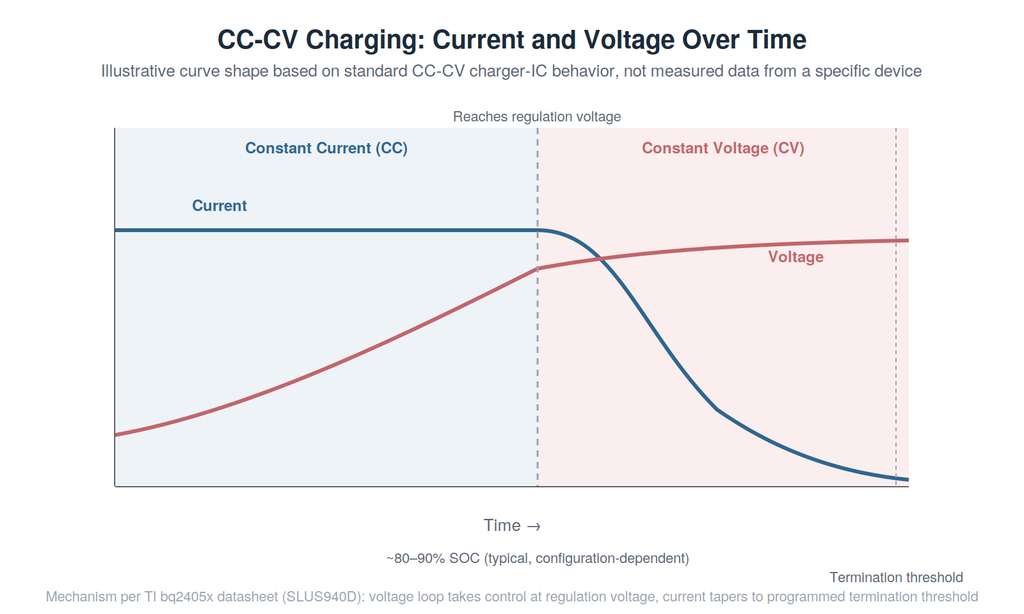
Internal resistance also isn’t fixed across state of charge. During the constant-current (CC) phase of charging, the cell’s terminal voltage rises as state of charge increases — partly because the cell’s own open-circuit voltage rises with SOC, and partly from the IR drop across its internal resistance. Once terminal voltage reaches the charger’s programmed regulation voltage limit — around 4.2V for conventional Li-ion designs, though some modern high-voltage cells use higher regulation voltages — the charger switches to constant-voltage (CV) mode and progressively reduces current to hold that voltage as the cell continues accepting charge.
TI’s own charger-IC documentation describes this transition explicitly: the voltage loop takes control once the cell reaches regulation voltage, holding the battery there while current tapers toward a programmed termination-current threshold set by the charger and cell design. Internal resistance, polarization, chemistry, temperature, and state of charge all influence exactly where and how quickly that transition happens — commonly cited as occurring somewhere around 80–90% state of charge for typical charge rates, though the exact point is configuration-dependent.
But the transition itself is governed by the charger reaching its voltage regulation limit, not simply by “the resistance curve” in isolation. That’s still why the last stretch of a “fast charge” rarely happens at the advertised peak wattage — that number describes the constant-current phase, not the session.
The C-Rate/Temperature Bind
Pushing higher C-rate (charge current relative to capacity) to shorten charging time doesn’t just generate more instantaneous heat. It changes which degradation mechanism dominates, and that mechanism is temperature-dependent in a way that leaves no universal safe rule.
High C-rate charging combined with low temperature can promote lithium plating on the anode, creating deposits associated with capacity loss and increased short-circuit and safety risk — a mechanism documented in peer-reviewed fast-charging research (Qin, Y. et al., Journal of Energy Chemistry, 2022, 72(9): 442–452; cited at abstract level, full methodology not independently verified). A 2022 Journal of Energy Storage study on combined C-rate and temperature effects found something less intuitive: as operating temperature rises, the dominant degradation mechanism shifts gradually from lithium plating toward growth of the solid-electrolyte interphase (SEI) layer, in that study’s tested cells and conditions. The same underlying tension between lithium plating and interface degradation shows up, in a very different form, in next-generation battery chemistry — see Solid-State Batteries Explained for how solid-electrolyte EV cells fight the same dendrite-formation problem without a liquid electrolyte to fall back on. Capacity fade at higher C-rates was partially alleviated by higher operating temperatures in that study, while capacity fade at lower C-rates accelerated as temperature increased. There is no single “colder is safer” or “warmer is safer” rule — the correct thermal target depends on the C-rate in play.
Given this, the honest framing of the article’s central engineering insight isn’t that internal resistance alone is “the” bottleneck — it’s that allowable charge rate is set by a coupled system: electrode kinetics and polarization, the lithium-plating threshold, the cell’s voltage limit, temperature, impedance, and the phone’s power-delivery and thermal architecture, all interacting simultaneously. Internal resistance is one of the hardest-to-pin-down variables in that system, because it moves with temperature, SOC, and age in ways the other stages’ losses generally don’t.
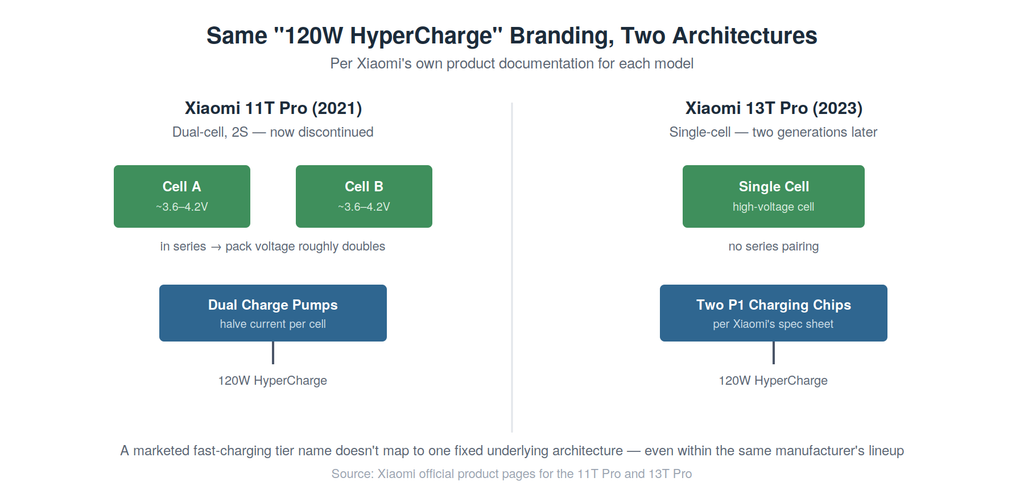
Some manufacturers sidestep part of this bind architecturally — though which specific architecture they use has shifted even within a single product line, which is itself informative. Xiaomi’s 11T Pro (2021) paired dual charge-pump ICs with a dual-cell (2S) battery architecture: two cells in series roughly double pack voltage relative to a single-cell design at equal power, which, by basic circuit relationships (P = VI), permits roughly half the pack current — directly reducing I²R losses in the high-current portions of the path. Two full product generations later, the 13T Pro (2023) achieves the same “120W HyperCharge” branding using a single-cell battery with two charging chipsets instead, according to Xiaomi’s own product documentation. The 11T Pro itself is now a discontinued, several-generations-old model — it’s cited here as a documented historical example of the architecture, not a claim about Xiaomi’s current lineup. That’s worth noting on its own: a marketed fast-charging tier name doesn’t map to one fixed underlying architecture, even within the same manufacturer’s lineup over time. One charge-pump IC manufacturer’s own published engineering data claims a comparable 2S charge-pump architecture cuts battery heat to roughly a quarter of a comparable single-cell design at equal charging power — a manufacturer-stated performance claim, not an independently measured result, and it should be read as such.
This is the coupled constraint that makes phone charge-management firmware genuinely difficult to get right. A PNAS study on lithium-plating-free fast charging identified an optimal charge temperature near 25°C for a 3.5C rate, specifically balancing plating risk against SEI growth — but that approach used an internally heated 9.5 Ah NMC622 pouch-cell architecture built for the study. The specific self-heating architecture used in that research is not documented in the phone systems discussed here, and consumer phones’ most visible controls remain current throttling and temporary charging pauses, though the underlying power-management system can also adjust bus voltage, conversion mode, and other parameters less visible to the user — which is why “my phone isn’t charging as fast as it says on the box” is a common, and largely accurate, observation, especially when the phone starts out warm or cold. The same throttle-or-pause logic shows up in even more thermally constrained devices — see Smart Glasses Could Replace Smartphones — But the Hardware Isn’t Ready Yet for how an even tighter thermal budget forces the same tradeoff during active use, not just charging.
Warmth during charging is not, by itself, evidence of a fault or evidence that a specific protection threshold has just been crossed. What’s well documented is that phones monitor temperature continuously and can reduce or suspend charging when internal thermal limits are reached — Apple’s own thermal-charging documentation confirms this behavior explicitly for iPhone. The warmth you feel is consistent with a system operating inside that monitored envelope, not proof of any single event.
The Constraint Worth Watching
The engineered power-delivery elements upstream of the battery — the AC-DC adapter, the cable, the charger IC — are components whose losses can be characterized against known, controlled operating conditions: voltage, current, temperature, all documented on a datasheet. (PD negotiation itself, unlike these, is a control process with no power-loss curve of its own — it sets the terms the other stages then have to convert or carry.) That’s not the same as saying those losses are constant; the Renesas and TI data cited throughout this piece show clearly that conversion efficiency itself varies with input voltage, output current, and operating point. The difference is that this variation is predictable and bounded by design. The battery’s internal resistance can be characterized too, but it doesn’t just respond to a known, controlled operating point — it drifts with age and cumulative degradation in ways a datasheet, written before the cell has cycled hundreds of times, can’t fully predict ahead of time.
That’s the constraint that deserves more attention as manufacturers keep pushing peak wattage numbers higher — 65W, then 120W, and beyond. A bigger number on the box doesn’t rewrite the cell’s resistance curve or resolve the plating/SEI tradeoff underneath it; it hands the charge controller a harder version of the same negotiation it’s always run: how much current a specific cell, at a specific temperature and age, can accept right now without pushing itself toward plating on one side or SEI growth on the other. I expect the next meaningful advances to depend increasingly on cell chemistry and pack architecture — like the dual-cell approach Xiaomi shipped in one generation and moved away from in the next — that widen the room the controller has to negotiate in, though thermal management, power semiconductors, and charging algorithms will all keep contributing too.
About the Author
Imran Valiani | Sales Director, PCB Electronics Manufacturing
20+ years working with major Bay Area and global tech clients. Founder of Silicon to Software, where I write about the hardware layer — PCB fab, AI gear, autonomous systems, and cyber — the stuff most tech writers have never touched. Literally.
Follow: X @SiToSoftware | LinkedIn
This article was developed with AI assistance and edited, fact-checked, and reviewed by the author. See my full AI disclosure.
Listen to the Silicon to Software podcast on Apple Podcasts, Spotify, or RSS.com — and watch on YouTube.
Sources
Official standards documentation
- USB Implementers Forum — “USB Charger (USB Power Delivery)”, usb.org
- USB Implementers Forum — USB Power Delivery document library (current revision: Specification Revision 3.2, Version 1.2, May 20, 2026)
Manufacturer datasheets and application notes
- Renesas Electronics — “Application Note: USB-C 240W Power Delivery 3.1 Extended Power Range Protocol,” R16AN0074EU0100 Rev.1.00, March 6, 2025
- Texas Instruments — bq2405x datasheet (SLUS940D), JEITA temperature-profile implementation
- Texas Instruments — BQ25790/BQ25792 product page
- Texas Instruments — BQ25910 product page
- SGMicro — SGM41578 product page
Company / official product documentation
- Apple Support — “Understand Thermally Limited Charging on iPhone”
- Xiaomi — 11T Pro official product page (dual-cell, dual charge-pump architecture)
- Xiaomi — 13T Pro official product page (single-cell, two P1 charging chipsets)
Peer-reviewed research
- Mahmud, A.H., Che Daud, Z.H., Asus, Z. — “The Impact of Battery Operating Temperature and State of Charge on the Lithium-Ion Battery Internal Resistance,” Jurnal Mekanikal, Vol. 40, June 2017, pp. 1–8
- Yue, Y. et al. — “Effects of Temperature on the Ohmic Internal Resistance and Energy Loss of Lithium-ion Batteries Under Millisecond Pulse Discharge,” Journal of Physics: Conference Series, Vol. 2301, 012014 (2022 International Conference on Advanced Electronics, Electrical and Green Energy)
- “Concentrated Electrolytes Widen the Operating Temperature Range of Lithium-Ion Batteries,” Advanced Science (Wiley), available via PMC
- Qin, Y., Zuo, P., Chen, X., et al. — “An Ultra-Fast Charging Strategy for Lithium-Ion Battery at Low Temperature Without Lithium Plating,” Journal of Energy Chemistry, 2022, 72(9): 442–452, DOI: 10.1016/j.jechem.2022.05.010
- “Investigation on Lithium-Ion Battery Degradation Induced by Combined Effect of Current Rate and Operating Temperature During Fast Charging,” Journal of Energy Storage, 52 (2022) 104811
- “Fast Charging of Lithium-Ion Batteries at All Temperatures,” PNAS, June 25, 2018, available via PMC
- “A Review of Smartphone Energy Management: Power Distribution, Battery Technologies, Fast Charging, Thermal Management and Challenges,” ScienceDirect, 2026
Trade / secondary reporting
- Tom’s Hardware — “The USB Power Delivery (PD) Specification — Everything You Need to Know About USB-PD”
- Power Electronic Tips — “100-W Charge Pump Fast Charging IC Targets Smartphones, Mobile Hardware” (NuVolta NU2205)
Note: no manufacturer, teardown lab, or peer-reviewed source was located that publishes a stage-by-stage percentage breakdown of charging heat for any specific current-generation phone — that gap is disclosed directly in the article rather than estimated around.