How LEDs, photodiodes, and analog electronics turn reflected light into a heartbeat, and where the measurement breaks.
Mid-workout, you glance at your wrist and the number has moved. Nothing pierced your skin. No wire runs to your chest. The watch never touches your heart, and it can’t see it.
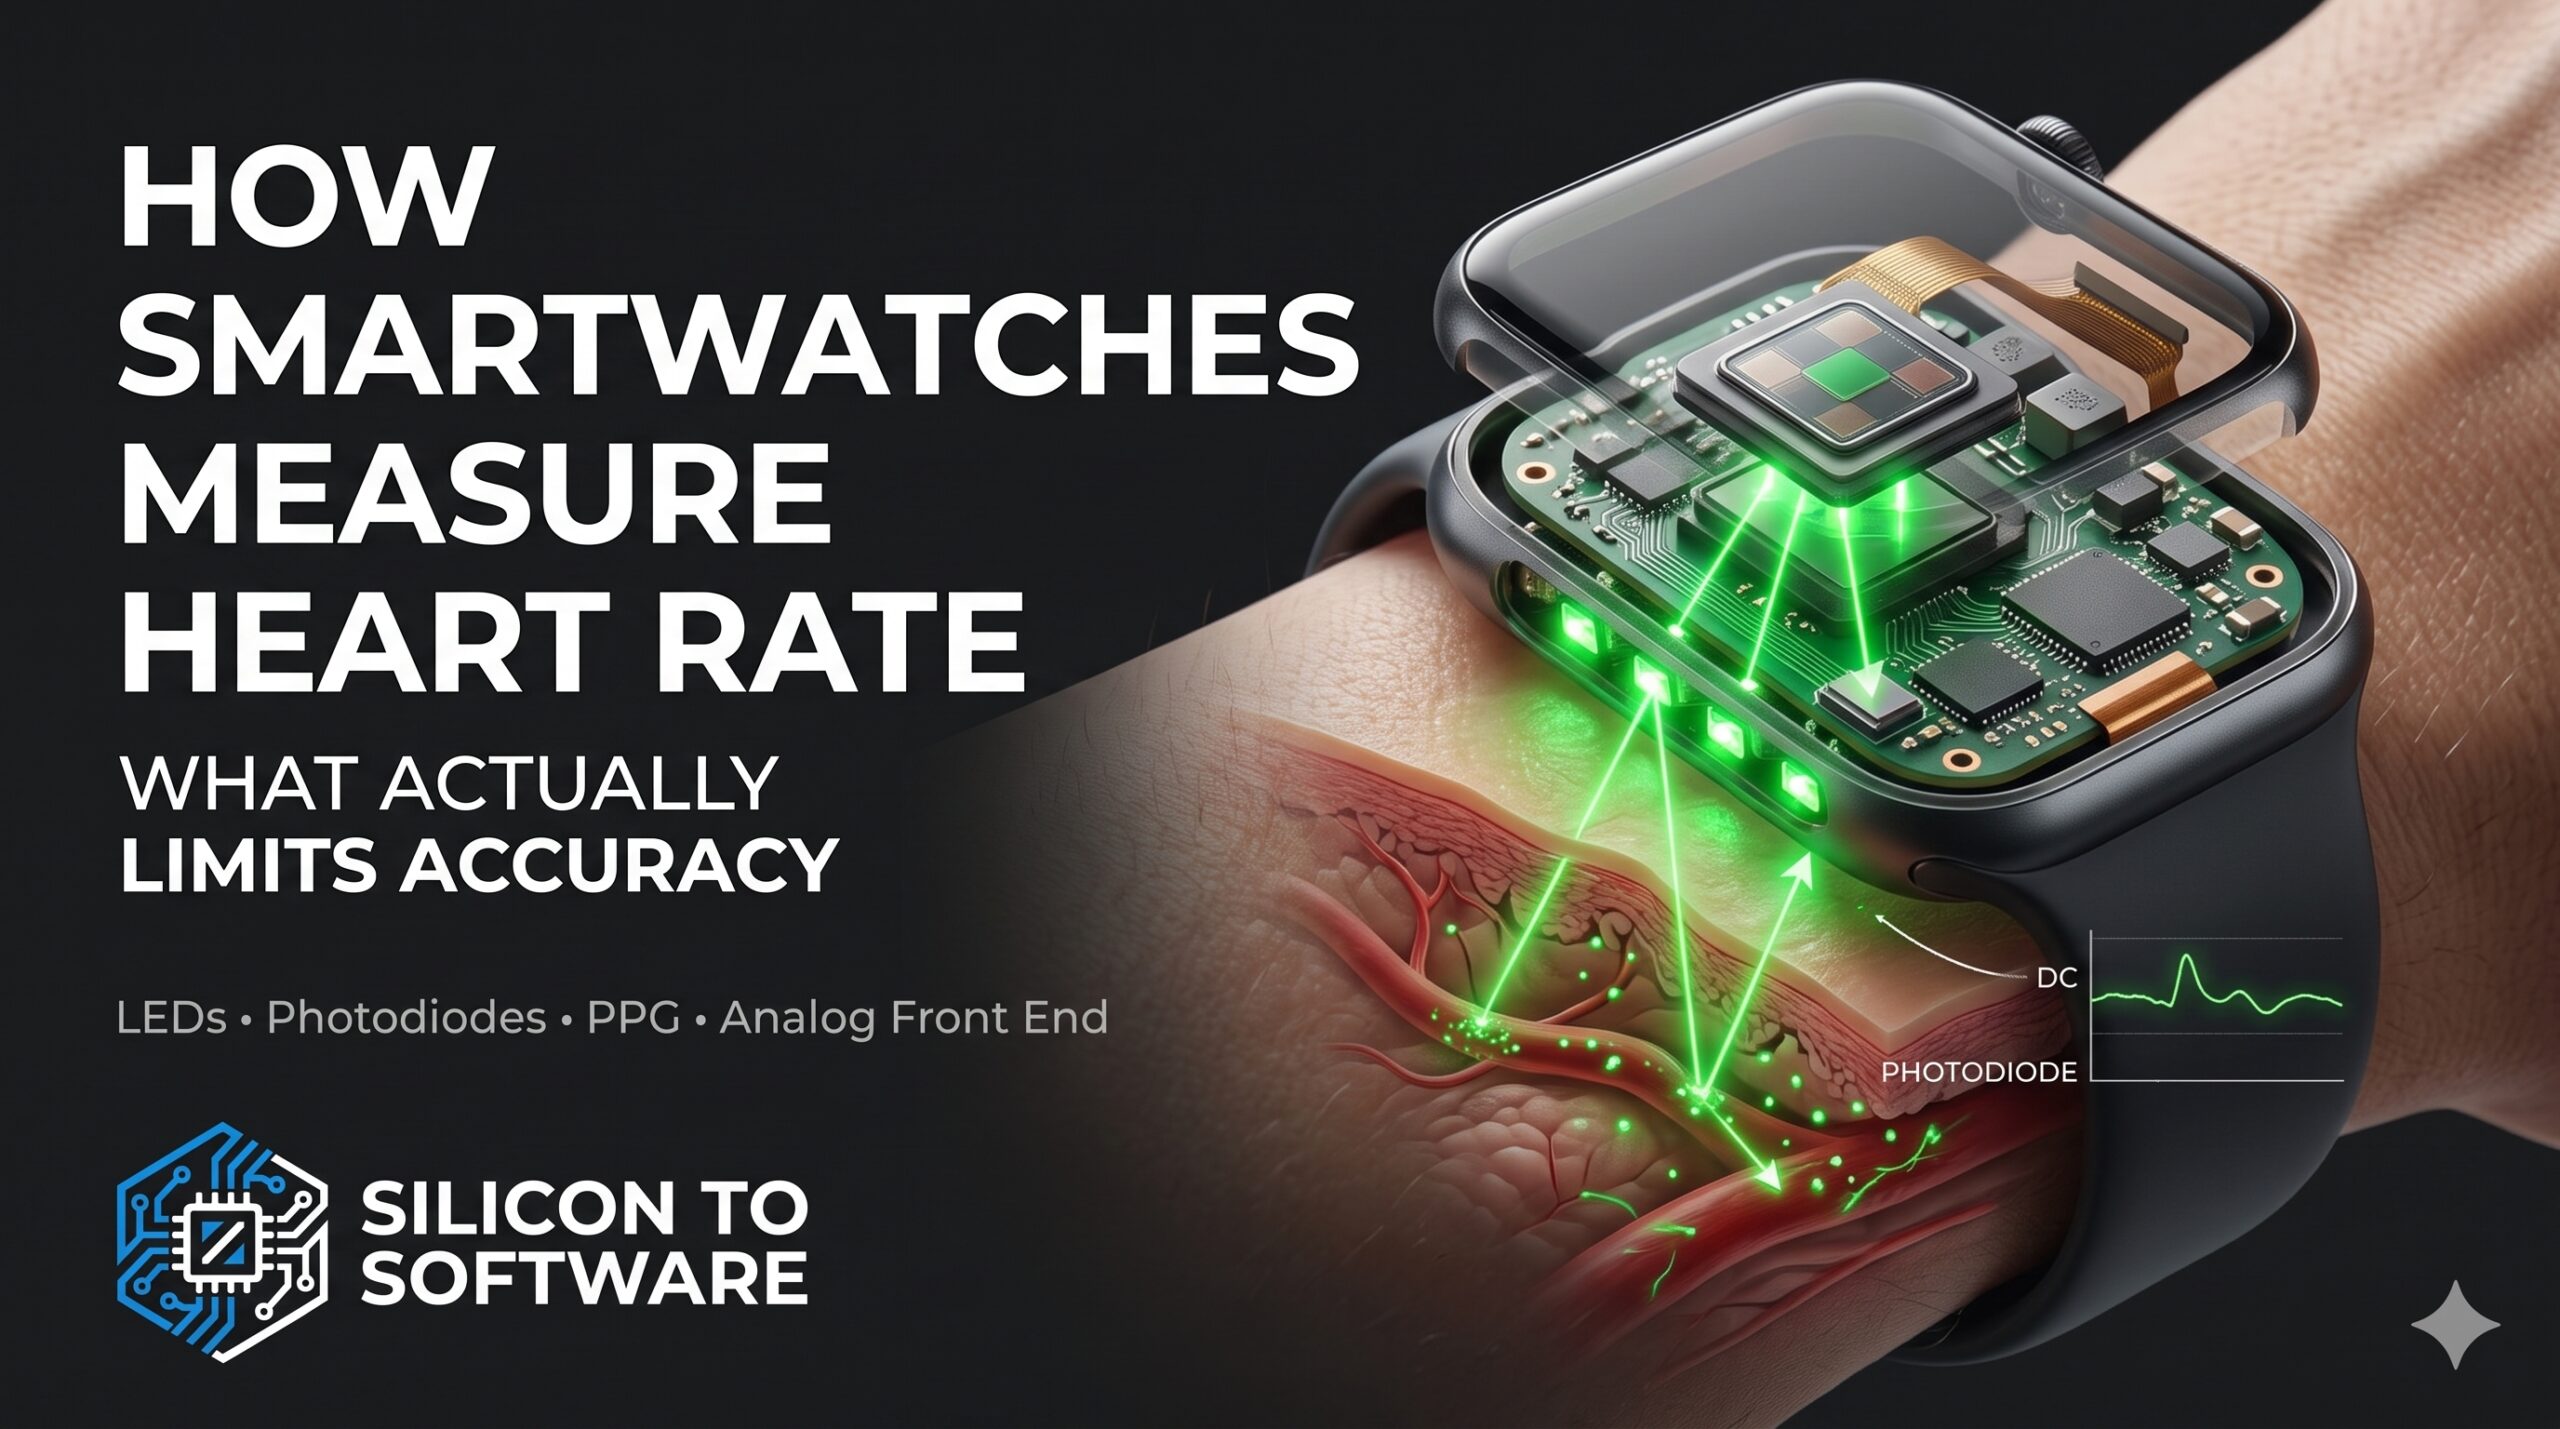
According to Apple’s current support documentation, the watch flashes LED light into your wrist hundreds of times per second and uses photodiodes to detect how much blood is flowing through it. [1] That returned light carries the physiological signal the watch is trying to recover. The technique is photoplethysmography (PPG), an optical method for detecting blood-volume changes in tissue. [2] Everything downstream, the amplifier, the ADC, and the filtering, exists to pull a small, noisy ripple out of it.
So accuracy isn’t a single property of the technology. Published testing finds significant differences between devices and between activity types. [3] The useful question is where along the signal chain the measurement is won or lost. This article follows the chain in order: LED → tissue → blood-volume modulation → reflected light → photodiode → analog front end (AFE) → ADC → filtering and algorithms → heart-rate estimate. It covers optical heart-rate estimation on consumer watches, not diagnostic use.
My position is that the signal the interface delivers sets a bound on accuracy before any algorithm sees the data. The evidence points to a device-dependent limit that better implementation has pushed back, rather than a single fixed ceiling. I work in technical sales for PCB electronics manufacturing, so I read this system from the manufacturing side rather than as an optical or firmware designer: the tolerances and layout constraints that sit between the optics and the electronics.
Key takeaways
- The watch infers heart rate from a small pulsatile change in reflected light; on the wrist, that pulse is a small fraction of the total signal.
- Fit, crosstalk, and front-end design determine how much of that pulse reaches the algorithm. Motion is the most consistently documented error source in the studies cited here.
- Evidence on skin tone and accuracy is unsettled, and the public record does not establish how error divides between hardware and algorithm.
- Apple’s September 2026 accuracy study is company-authored and not peer-reviewed.
Table of Contents
How Smartwatches Measure Heart Rate: What PPG Actually Detects
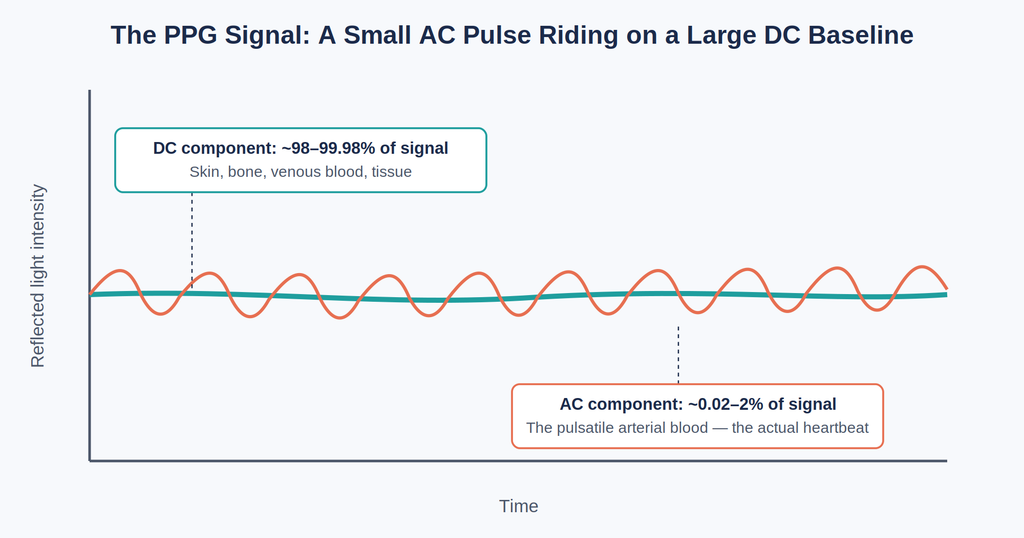
AC and DC: a small pulse on a large baseline
The sensor doesn’t detect the heartbeat directly. It detects changes in reflected light associated with pulsatile changes in blood volume. Allen’s review describes the PPG waveform as a pulsatile “AC” component, tied to cardiac-synchronous blood-volume changes, riding on a slowly varying “DC” baseline. [2] On the wrist, that AC component is small. Analog Devices’ 2019 application note puts wrist perfusion-index values (AC divided by DC) between 0.02% for a very weak pulse and 2% for an extremely strong one. [4] That is a manufacturer’s range from an application note, not a measured population statistic. Pulse-oximetry data show why: one 2024 review reports healthy-adult finger values of 1.4 in one study and 3.9 in another, and notes that different devices and populations may explain the gap. [5]
Why the wrist uses reflective sensing
The LED and photodiode sit in the same plane, so the sensor reads reflected light. ADI notes that transmissive measurement is logistically difficult at the wrist, which is why reflective sensing is used. [4]
Green, Red, or Infrared: How the LED Wavelength Gets Chosen
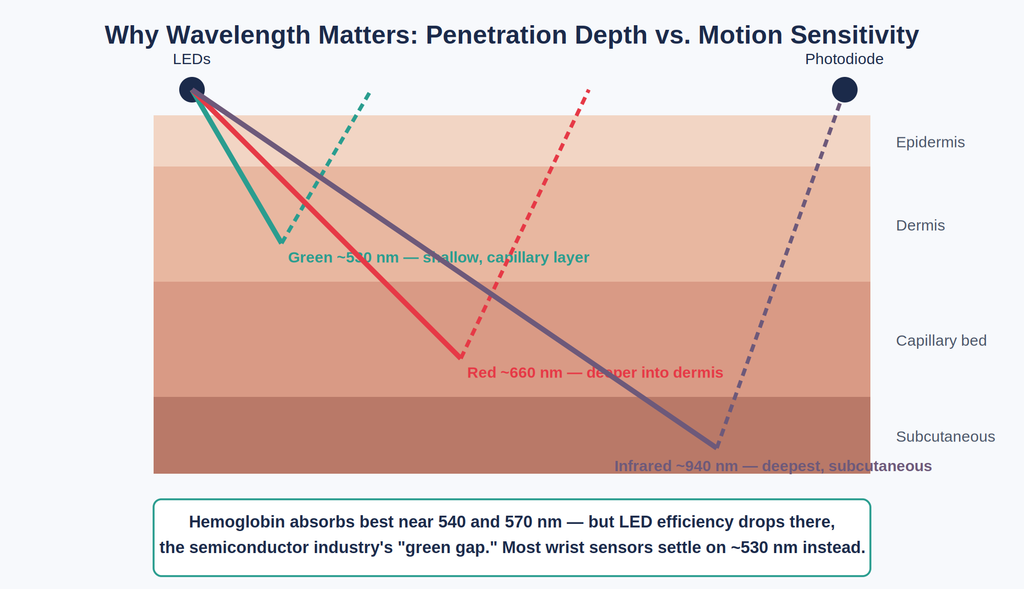
Apple’s current documentation says the LED color depends on the watch model, your activity level, and whether you’re sleeping. [1] Series 12 and Ultra 4 use green LEDs continuously during the day, measuring as often as every five seconds even in motion, and Apple says infrared LEDs are used during a sleep schedule or when a sleep focus is turned on manually. [1] Apple lists the factors but not the trade-offs behind them.
ADI supplies the physics behind the green preference. ADI says the illumination wavelength should be as close as possible to the absorption peaks of oxygenated hemoglobin (HbO2) near 540 nm and 570 nm. But because of the known “green gap” in LED luminous efficacy around 560 nm, commercially available LEDs are very dim at those wavelengths, so green LEDs near 530 nm are used in most commercial PPG sensors. [4] A 2023 peer-reviewed review reports the same practice: wrist-worn devices mainly use green light (492–577 nm), whose absorption by hemoglobin stays relatively constant across a wide range of oxygen saturation and which penetrates shallowly, making it less susceptible to motion artifacts than red or infrared. [6] A 2026 narrative review also puts green-light PPG for heart rate at approximately 530 nm. [7]
Peer-reviewed data point the same way. Zhang et al. describe green light as reaching mainly the capillary layer, which gives a higher AC/DC than red or infrared light, both of which penetrate deeper. [8] Fallow et al. tested four wavelengths (470, 520, 630, and 880 nm) on 23 adults. At rest, green (520 nm) gave greater modulation than the others regardless of skin type, and during exercise blue and green gave better signal-to-noise ratios than red or infrared. [9] That study is from 2013, is small, and was funded by Omron Healthcare.
In my reading, the trade-off is signal strength against penetration depth, LED efficacy, and sensitivity to skin. Because the same watch can run different optical configurations depending on what it’s doing, the reading you get depends on model and mode.
The Optical Stack: Photodiode, Crosstalk, Spacing, and Air Gap
Crosstalk and the air gap
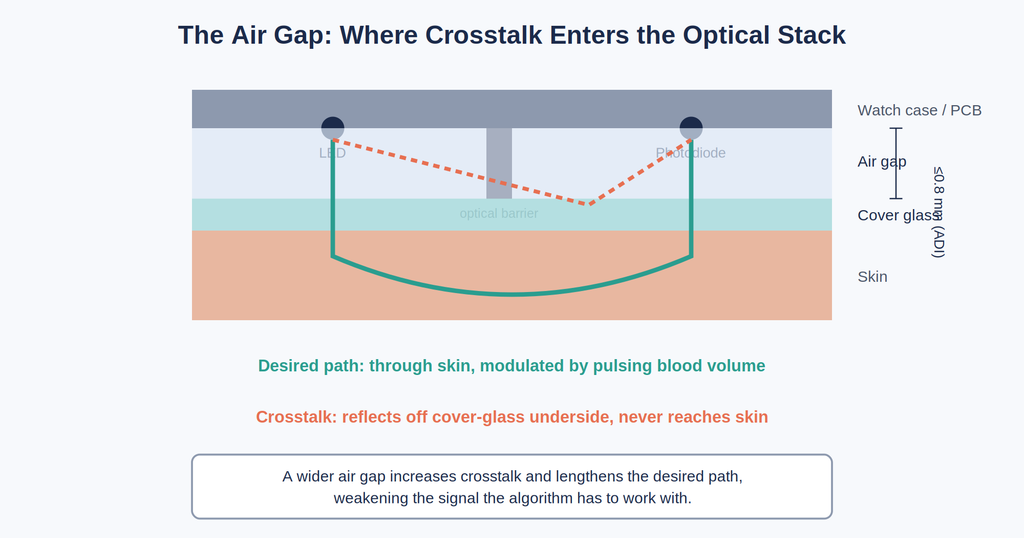
The photodiode converts returned light into a tiny current, and ADI reports that silicon PIN photodiodes have the highest responsivity across the visible and near-infrared range. [4] The part is only half of it. ADI defines crosstalk as light that reaches the photodiode without traversing any skin, and says high crosstalk can drown out the pulsatile signal. [4] Its wrist recommendations are absorbing barriers between LEDs and photodiode, a minimal air gap under the cover (no more than 0.8 mm), and a raised mesa to improve skin contact. [4]
ADI states the 0.8 mm figure as a recommendation for acceptable performance in its wrist, chest-patch, and earbud notes. [4, 10, 11] The earbud note (2019) ran a ray-trace simulation of gaps from 0.1 to 1.5 mm behind a 0.4 mm cover glass and found crosstalk rose with the gap. [11] The public record does not include independent corroboration of the number itself. What a second vendor does corroborate is the direction. A March 2021 Renesas design-in guideline for a finger-measurement sensor, as hosted by the distributor Avnet, measured crosstalk on a 0.3 mm polyethylene cover, not glass, at 6 to 7 ADC counts per mA with no air gap and 36 to 40 with a 1 mm gap. The same guideline’s 1 mm optical silicone cover rose from 12 to 75 (IR) and from 25 to 108 (red) counts per mA when a 1 mm gap was added. [12] Renesas’s January 2022 design guide for the same part doesn’t repeat those figures, but it names the distance between the module and the cover glass as the first design priority and the cover thickness as the second. [13]
A 2023 peer-reviewed review describes the same mechanism. In an integrated module, an optical barrier separates the LED and photodiode, but a gap forms between the module and the device when it is mounted, and crosstalk can also arise through the cover glass. Light that never passes through tissue adds to the DC component. [6] The review says an early wrist device, the 2014 Samsung Galaxy Gear Fit, lacked a perfect barrier rib and showed crosstalk, and that later devices moved to separate LEDs and photodiodes with a partition wall. [6]
LED-to-photodiode spacing
Spacing is a trade-off. Place the photodiode too close to the LEDs and it saturates on the large non-pulsatile light scattered by the outer skin layers. Place it farther away and you need more LED current to overcome the longer path, because detected light falls roughly exponentially with distance. [4] The 2023 review says penetration depth is roughly one third to one half of the source-detector separation, and that compact integrated modules make it hard to optimize LED and photodiode spacing. [6]
Fit: the band is part of the sensor
Apple says the watch should be snug but comfortable and worn above the wrist bone, and says to tighten the band if the back loses skin contact when you shake your wrist and turn your palm up. [14] Apple’s Watch User Guide adds that the right fit is not too tight and not too loose, and that water and sweat can cause a poor recording. [15] The sensors also work only on the top of the wrist. [16]
Fit isn’t just comfort. A 2025 Scientific Reports paper reports that skin-sensor contact pressure changes with wrist posture even while seated, and that suboptimal contact can distort waveform shape and shift peak timing, which degrades heart-rate and variability estimates. [17] It cites earlier work, including an in vitro tissue-vessel phantom study, finding an optimal contact pressure for signal-to-noise ratio, and one smartwatch-like device that estimated heart rate more accurately at higher contact pressure during exercise. [17]
Contact can also be too hard: a 2021 Renesas guideline for a finger-measurement sensor notes that pressing the sensor into the skin restricts blood flow and PPG modulation. [12] A 2023 review adds that external light leaking in, often because the device isn’t worn tightly enough, makes high-quality signals hard to get in daily life. [6] A 2013 variability review notes finger-PPG work finding that sensor contact force changes the AC and DC intensity of the signal, though whether it affects pulse-rate reliability had not been investigated. [18]
In my reading, the band is functionally part of the optical measurement system, because it controls how well the sensor couples to the skin.
The Analog Front End: Recovering a Small Ripple From a Large Baseline
One representative architecture
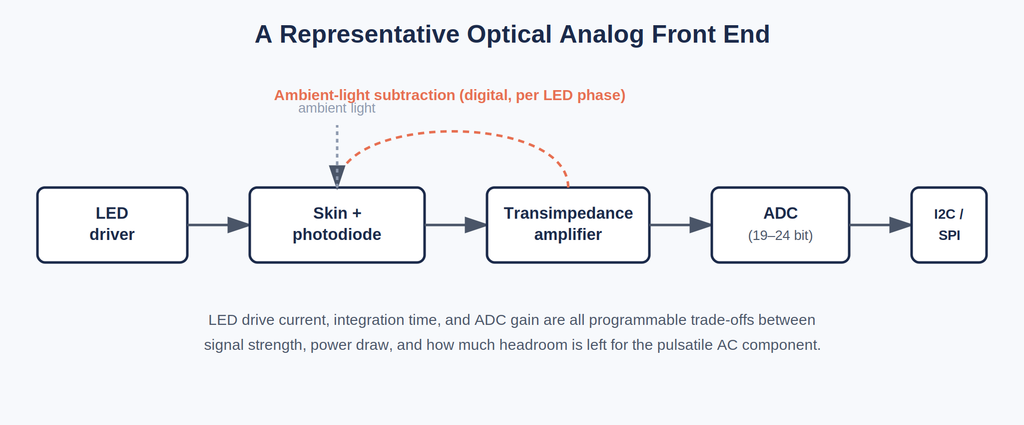
TI’s AFE4404 datasheet shows one representative architecture. It is a 2016 example part, and no source here ties it to any particular watch. [19]
- A transimpedance amplifier (TIA) converts photodiode current to voltage, with programmable gain from 10 kΩ to 2 MΩ.
- An ADC digitizes the result at 22 bits.
- The integrated LED driver is programmable to 50 mA, extendable to 100 mA.
- Ambient light is sampled in a separate phase and subtracted.
The design problem is the DC baseline. In TI’s architecture it limits the maximum gain, so an offset-cancellation DAC subtracts current at the TIA input, which lets the amplifier apply higher gain to the AC part. [19] TI’s design guidance lists good optics, good mechanical design, and a calibration loop as key factors. It recommends budgeting dynamic range across the DC current range, the AC-to-DC ratio across users, and artifact-induced current changes. [19] Apple describes the system-level version of the same idea: the sensor is designed to compensate for low signal levels by increasing both LED brightness and sampling rate. [1]
A second manufacturer’s approach
ADI’s MAX86141, a part in production with a Rev. 5 datasheet from 2023, has a 19-bit ADC, three programmable LED current DACs, and on-chip ambient light cancellation. It lists ambient rejection above 70 dB at 120 Hz and dynamic range above 89 dB in a loopback test, extendable above 110 dB for heart-rate monitoring with multiple-sample averaging. [20] Both parts pair on-chip ambient-light handling with programmable LED drive. A 2023 review notes, in a figure caption, that the Samsung Galaxy Gear Fit (2014) and Galaxy Watch 3 (2020) each use an AFE to measure the photodiode output. [6] None of these sources shows what an Apple Watch or any other specific model uses.
What Recovery Can Cost
ADI’s datasheet puts numbers on two of the costs. Its noise table shows input-referred dark-current noise falling from 262 pArms at the shortest integration time (14.8 µs) to 56 pArms at the longest (117.3 µs), and its supply-current table shows average LED current rising with sample rate: 185 µA at 25 sps against 1,880 µA at 256 sps, for a 62 mA pulse at 117.3 µs. [20] ADI’s application note adds that in practice the LED drive current is capped by a specified maximum power dissipation. [4] A 2023 review adds that lowering the sampling rate saves power but may reduce signal quality, and that adding photodiodes rather than LEDs reduces power consumption and heat. [6]
More gain risks saturation. In TI’s example part, the TIA holds the photodiode bias through negative feedback, so a saturated TIA output disturbs that bias. The recovery transient can spill into neighboring sampling phases and leave the ambient subtraction incomplete. TI’s answer is to prevent saturation in every phase through periodic signal monitoring and gain adjustment, even for phases the heart-rate algorithm doesn’t use. [19]
Every block between the photodiode and the digital output is a place gain, noise, and power trade off against each other.Where PCB Layout Meets the Optics
From a manufacturing standpoint, what stands out is that TI’s and ADI’s notes, read together, describe what I’d call tolerance, coupling, grounding, and power-integrity problems, not just component-selection problems.
The optical side: a tolerance budget
ADI says the air gap under the cover exists because of mechanical tolerances. [4] A 2023 review notes that a gap forms between an integrated module and the device when it is mounted. [6] The 2021 Renesas guideline adds that crosstalk can differ from assembly to assembly and change with contamination or mechanical pressure on a flexible cover, and that a plus or minus 0.1 mm alignment tolerance on its ink-mask holes leaves the total field of view similar but shifts its center direction by about 6 degrees. [12] Its 2022 design guide tells designers to evaluate worst-case tolerances for lid placement distance and alignment. [13] In my interpretation, the parts in that stack (module placement, the board or flex it sits on, the cover, and the housing) share one budget. None of these sources itemizes it.
The electrical side: routing and supply
The vendors agree on where the electrical side bites. ADI’s MAX86141 datasheet calls the handling of the PD_IN and PD_GND nodes the most critical aspect of the layout, because parasitic capacitive coupling into PD_IN injects noise into the front end. It says to shield PD_IN fully with a coplanar PD_GND trace, keep other traces and vias out of that shield, extend the shield beneath the photodiode because the cathode is most of the silicon, and tie PD_GND to the board ground at one point. It also specifies a 10 µF capacitor from the LED supply to power ground, a 0.1 µF capacitor as close as possible to the analog supply bump plus 10 µF (the datasheet’s layout section specifies a 22 µF 0402 capacitor for the combined supplies, which it says is about 10 µF effective after voltage derating), and a 1 µF capacitor on the reference pin, each with its own via. [20]
TI’s application notes, which TI says are not part of the component specification, describe LED-switching ground bounce coupling into the receiver, photodiode inputs that are prone to picking up noise, decoupling that belongs close to the device, and, near BLE radios, a common-mode choke that may be needed. [19]
Because the pulse is such a small fraction of the DC baseline, photodiode routing and LED-supply decoupling are layout decisions, not afterthoughts.
In my reading, the optics, the mechanics, and the board share one coupled tolerance and noise budget, so the module has to be specified and validated as a system. The sources cited here don’t cover rigid-flex versus rigid construction, placement accuracy, or production test of the optical module, and this article doesn’t address them.
Motion Artifacts: Why Running and Lifting Break the Reading
Motion is the most consistently documented source of error in the studies cited here. Bent et al. name three sources of inaccuracy: skin type, motion artifacts, and signal crossover. Their abstract reports that absolute error during activity was on average 30% higher than at rest. [3]
The paper describes motion artifacts as typically caused by displacement of the sensor over the skin, skin deformation, blood flow dynamics, and ambient temperature. Signal crossover, which the paper describes citing industry commentary, is the sensor locking onto the periodic signal from repetitive motion, such as walking or jogging, and mistaking it for the cardiovascular cycle. [3] A 2021 peer-reviewed review of heart-rate tracking under motion describes the underlying problem in the same terms: motion artifacts can add spectral content that overlaps or sits close to the true heart rate, and can mask the heart-rate peak in the spectrum. [21] In walking, error was significantly higher for every device tested except the Apple Watch 4. Devices differ. [3]
Apple’s own guidance follows the same pattern. Rhythmic movements such as running or cycling give better results than irregular movements such as tennis or boxing. [16] Apple’s September 2026 accuracy study, which Apple authored, says it deliberately included activities that are hard for optical sensing, and names cadence lock in running, forearm grip loading in strength training and cycling, and rapid wrist motion in interval training. [22] Apple uses the term cadence lock for the running case without defining it in that document.
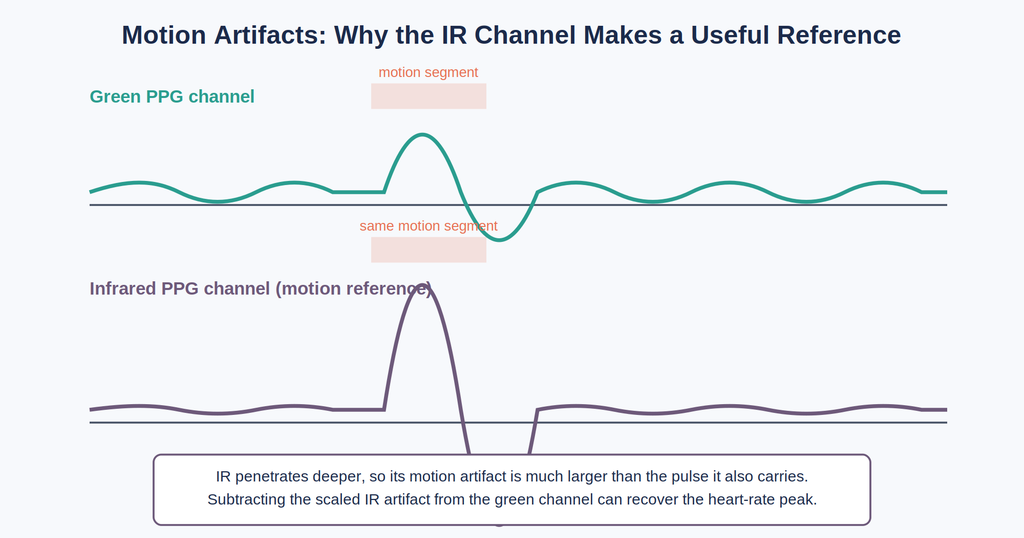
Zhang et al. explain why the problem is hard. Motion artifacts can exceed the pulse in amplitude and fall in the same frequency range as heart rate. Wrist PPG can suffer more intense and complicated artifacts than finger PPG because of wrist flexibility. Most existing artifact-reduction methods use a motion reference, often an accelerometer, though micromotions such as finger tapping are poorly captured by wrist accelerometers. [8] The 2013 variability review makes the opposite point about the fingertip: its exposed position at the edge of a limb makes finger sensors susceptible to motion artifacts, which is why researchers tried central sites such as the earlobe. [18]
Zhang’s alternative uses an infrared PPG channel as the motion reference for the green channel. On six subjects and 21 motion types, it reduced average error from 4.3, 3.0, and 3.8 bpm to 0.6, 1.0, and 2.1 bpm across periodic, random, and continuous non-periodic motion. A motion-detection step keeps it from removing the real heart-rate component when the wrist is still. [8]
One caution: the paper’s methods section lists its “green” LED at 660 nm, which is normally a red wavelength, so read its wavelength labeling with care.
TROIKA, another academic framework, combines signal decomposition, sparse reconstruction, and spectral peak tracking, and reported an average absolute error of 2.34 BPM on 12 subjects running at up to 15 km/h. [23] Both are small academic datasets. Neither is evidence of what any commercial watch runs.
Skin Tone, Perfusion, and Signal Quality: What the Evidence Supports
This question is contested, and the record has moved since 2020.
Bent et al. (2020) found no statistically significant accuracy difference across skin tones, but significant differences between devices and activity types. [3] Their devices were an Empatica E4, Apple Watch 4, Fitbit Charge 2, Garmin Vivosmart 3, Xiaomi Mi Band, and Biovotion Everion. [24] A published response cited the small sample size and the limitations of the Fitzpatrick scale. The authors replied, acknowledging that visual skin-tone scales are imperfect and that a study can never prove the null hypothesis. [24, 25]
A systematic review covered 10 studies and 469 participants. Four reported significantly lower accuracy in darker-skinned individuals, four found no effect, and two were mixed. The authors called the evidence inconclusive and asked for larger samples and more objective skin-tone measurement. [26]
The 2025 study measured pigmentation objectively with a colorimeter (Individual Typology Angle) in 28 adults, using a Polar H10 chest strap as the criterion. The authors say none of the earlier studies on skin tone and PPG heart-rate accuracy measured epidermal melanin. [27]
- Pigmentation did not significantly predict error for the Apple Watch Series 8 or Garmin vivosmart 5. For the SlateSafety BAND V2, it added about 1 bpm.
- Missing data with no identifiable cause fell disproportionately on participants with darker skin for the Apple Watch and SlateSafety devices but not the Garmin, and outliers fell disproportionately on participants with darker skin for all three devices. [27]
- The protocol was stationary cycling, chosen to minimize motion artifact. The authors say they cannot rule out an interaction between pigmentation and motion in less controlled conditions. [27]
A May 2026 study in Sensors tested an Apple Watch Series 8, Garmin Forerunner 955, Fitbit Sense 2, and Samsung Galaxy Watch 5 on 58 Hispanic adults with Fitzpatrick skin types III to V, using a Polar H10 reference during low-motion recumbent cycling. All four deviated systematically from the reference, with mean absolute errors of 2.51 (Apple), 2.93 (Garmin), 3.38 (Samsung), and 3.89 bpm (Fitbit).
Relative error was higher for the four Fitzpatrick V participants (mean 4.48%, against 2.87% for type III and 2.72% for type IV), but the authors call every Fitzpatrick V result provisional, and type VI wasn’t represented. Higher BMI was also associated with larger bias and lower reliability. [28]
The 2025 and 2026 studies differ in devices, sample size, and how skin tone was measured (a colorimeter against self-reported Fitzpatrick type), so their findings can’t be stacked.
Separately, Fallow et al. reported significantly lower modulation for dark brown skin (type V) than for other types. That is a signal-level finding, not an accuracy finding. [9]
Perfusion adds variation independent of skin tone. Apple says perfusion varies significantly from person to person and with the environment, that cold can leave wrist perfusion too low for a reading, and that some tattoos can block light from the sensor. [16]
One vendor addresses the range explicitly: ADI’s datasheet tells designers to set the proximity-wake threshold so that a device mounted on the darkest skin still returns a signal above it. [20]
Two caveats apply. Manufacturers issue software updates, and the PhysioNet record for the Bent dataset, recorded in 2019, itself warns that updates have likely been released since. [29] And the 2025 authors, without access to raw PPG or the algorithms, could not tell whether darker skin reduced the underlying signal. They speculate that heart-rate detection depends on waveform shape more than absolute amplitude, which could help explain their results. [27]
A 2026 living review of 82 Apple Watch studies could not run subgroup analyses by skin tone or body mass index because those characteristics were reported so infrequently. [30] It also found agreement was lower during exercise with irregular movement patterns and among individuals with arrhythmia. [30]
A July 2026 narrative review adds that heart-rate validity can differ across age, body mass index, and sex groups, with direction and magnitude varying by device and study, and that validation results shouldn’t be assumed to generalize unless subgroup performance was evaluated and reported. [7]
The public record supports “unsettled”: it doesn’t settle a finding of bias or of no effect.
Wrist PPG vs Fingertip PPG, ECG, and Arterial-Line Measurement
These methods measure different quantities under different conditions, so they aren’t scored on the same footing.
PPG isn’t ECG. The gold standard for analyzing beat-to-beat variability is RR intervals from an ECG. A 2013 review of studies comparing pulse-derived heart rate variability with ECG concluded that variability estimates have been shown sufficiently accurate only for healthy, mostly younger subjects at rest. Agreement for average heart rate was generally very good, particularly at rest. Short-term variability was somewhat overestimated, and with walking or exercise the agreement often became insufficient. Most of those studies used finger or ear sensors, not wrist watches. [18]
The pulse also lags the electrical event. The review describes a delay between each ECG R peak and the onset of its pulse wave, called pulse transit time. [18] Apple Watch Series 4 and later carry separate electrodes for electrical measurements. Apple says placing a finger on the Digital Crown gives a measurement every second instead of every five seconds. [1]
Wrist PPG also isn’t fingertip PPG. A 2023 review says finger-based transmissive PPG can yield high-quality signals when properly positioned and secured but can restrict hand movement, and that the reflective sensors used at the wrist typically have lower signal-to-noise ratio than transmissive finger sensors. [6] A site comparison summarized in the 2013 review found finger sensors gave the best cardiac signal among the sites tested at rest, the forearm the poorest, and the other sites, including the wrist, ranged in between. [18] Finger contact isn’t guaranteed either. In a five-participant field test, the enhanced wrist signal sometimes outperformed the finger reference, which the authors attribute to poorer finger contact after an initial fit. [17]
Wrist PPG is reflective, optical, and dependent on how the band holds the sensor. [4, 8] ECG is electrical. It was the comparison standard in Bent et al., and a Polar H10 chest strap was the criterion in the 2025 and 2026 studies. [3, 27, 28] An arterial line is invasive blood-pressure measurement through cannulation of a peripheral artery, providing continuous real-time data. [31] It measures pressure, so it isn’t a wrist heart-rate benchmark. Further up the invasiveness spectrum are implantable devices that monitor cardiac signals continuously from inside the body; see Implantable Medical Devices: How the Hardware Actually Works for how those biosensors, and their hermetic packaging, are built to survive there for years.
A voluntary standard exists for testing consumer heart-rate devices. The current revision, ANSI/CTA-2065-A-2023, defines performance criteria for consumer technology that measures heart rate under constrained laboratory conditions. [32] ANSI/CTA-2065.1-2023, Real World Analysis, uses the ANSI/CTA-2108 framework for validation under naturalistic or unconstrained test conditions to refine key components of 2065-A. [33] Bent et al. report following the CTA guidelines for their protocol. [3]
The standard’s text is paywalled and was not reviewed for this article, but a 2021 study that applied the 2018 protocol to consumer devices describes it: a chest-strap reference; sedentary, daily-living, walking, jogging, running, and cycling segments; and quotas of at least 25% lighter-skinned (Fitzpatrick 1–3) and at least 25% darker-skinned (4–6) participants, plus body-mass-index quotas. That study called a device valid only if its mean absolute percentage error was below 10%, its intraclass correlation above 0.90, and it was statistically equivalent to the chest strap. [34]
A 2026 study adapted the protocol for a recumbent-cycling test. [28]
Key Figures in This Article and How Much Weight Each Deserves
| Figure | What it is | Source type | Weight |
|---|---|---|---|
| 0.02%–2% wrist perfusion index | Illustrative range from an application note | Manufacturer (ADI, 2019) [4] | Not a population statistic |
| No more than 0.8 mm air gap | Design recommendation | Manufacturer (ADI, 2019) [4] | No independent corroboration of the number |
| 6–7 vs 36–40 ADC counts/mA | Measured crosstalk, 0.3 mm polyethylene cover, no gap vs 1 mm gap | Manufacturer (Renesas, March 2021 guideline hosted by Avnet) [12] | Finger-oriented part, non-glass cover; not repeated in Renesas’s 2022 guide; corroborates direction only |
| 10 kΩ–2 MΩ gain, 22-bit ADC, 50 mA LED driver | TI AFE4404 example part (2016) | Manufacturer datasheet [19] | Illustrative only; no source ties it to a specific watch |
| 19-bit ADC, >70 dB ambient rejection, >89 dB dynamic range | ADI MAX86141 (Rev. 5, 2023) | Manufacturer datasheet [20] | Company-stated |
| 185 µA vs 1,880 µA LED supply current | 25 vs 256 sps, 62 mA pulse, 117.3 µs | Manufacturer datasheet [20] | Specific to stated test conditions |
| 30% higher error during activity | Average absolute error vs rest | Peer-reviewed (Bent et al., 2020) [3] | 2020 devices |
| 4.3/3.0/3.8 → 0.6/1.0/2.1 bpm | Motion-reference algorithm, 6 subjects, 21 motion types | Peer-reviewed (Zhang et al., 2019) [8] | Small academic dataset; wavelength labeling inconsistent |
| 4 lower / 4 no effect / 2 mixed | 10 studies, 469 participants | Peer-reviewed systematic review [26] | Called inconclusive by its authors |
| Mean absolute error (MAE) 2.51–3.89 bpm; mean absolute percentage error (MAPE) 4.48% for Fitzpatrick V | 58 adults, four devices | Peer-reviewed (2026) [28] | Fitzpatrick V is n=4, provisional |
| Lower overall error than each of six comparators | 1,254 participants with paired data, each compared against one device | Apple-authored study (2026) [22] | Company-authored; not peer-reviewed |
Where the Signal Chain Is Weakest
On the evidence above, the weakest link appears to be where light meets skin, not the silicon. In my reading, LED wavelength, source-detector geometry, optical isolation, and front-end gain all inherit whatever coupling the band delivers.
Three lines of work support that reading and one qualifies it. A 2023 review says that despite advanced signal processing, accurately restoring the phase and amplitude of motion-contaminated signals remains challenging. [6]
A 2025 paper finds only 19.6% of cycles in four sedentary public datasets had the full ideal waveform shape (systolic peak, dicrotic notch, and diastolic peak). The authors note that heart-rate and variability estimates depend on precise peak timing, while features such as the dicrotic notch matter for applications like blood-pressure estimation. The same paper reports that a learned restoration step, trained on 22 young, healthy participants, lowered heart-rate error by roughly 21–22% on average across its datasets. [17]
A 2026 meta-analysis of Apple Watch heart-rate studies found narrower limits of agreement for the optical sensor from Series 6 onward (minus 3.68 to plus 2.59 bpm across 8 studies) than for older generations, with comparable mean bias (the review covers models through Series 9 and Ultra 2 and calls this analysis exploratory). [30]
The first says signal processing still struggles to fully restore motion-contaminated signals. The second says software can recover some of what a poor interface loses. The third says the sensor generation matters. That is the reading behind bounded rather than set.
The public record does not establish how error divides between the interface and the algorithm. The Apple Watch meta-analysis says it could not separate hardware from software effects because the updates are proprietary, and it cites a preprint reporting accuracy gains from algorithms alone. [30]
Apple’s own page states the limit. Even under ideal conditions the watch may not get a reliable reading for everybody, and for a small percentage of users various factors may make it impossible to get any reading. It also says occasional abnormally high or low readings may appear. [1]
Bent et al. noted in 2020 that wearable companies are responsible for assessing and reporting the accuracy of their products, and that little about their evaluation methods is made public. [3] Apple’s September 2026 study is a partial counterexample on disclosure: it describes design, exclusions, and statistical methods in detail, but the paper doesn’t state that raw data or algorithms are available, and its protocol was approved by review boards within Apple.
It reports lower overall error for the Apple Watch Series 12 than for each of six comparison devices in its workout and daily-living protocols. Participants wore the Apple Watch on one wrist and a comparison device on the other or, for the Oura Ring, on a finger, and 1,254 contributed at least one paired measurement; 20% of them were Fitzpatrick V or VI. Of 159 activity-by-metric comparisons, Apple reports the Apple Watch better in 139 at its 99% confidence level, indeterminate in 18, and the comparison device better in 2. Apple’s conclusion is limited to the devices evaluated in the study. [22] Apple’s September 9, 2026 press release says the study used commercially available bestselling wearables available as of June 2026, with testing in July and August 2026. [35]
It is company-authored and not peer-reviewed, and it doesn’t report results broken out by skin tone. What engineers should watch is independent validation across skin tones and activities on current hardware and firmware, including the missing-data and outlier rates the 2025 study started to report.
The claim I’d defend is this. The number on your wrist is an inference from reflected light, and its quality is bounded by the signal the interface delivers to the algorithm.
About the Author
Imran Valiani | Sales Director, PCB Electronics Manufacturing
20+ years working with major Bay Area and global tech clients. Founder of Silicon to Software, where I write about the hardware layer — PCB fab, AI gear, autonomous systems, and cyber — the stuff most tech writers have never touched. Literally.
Follow: X @SiToSoftware | LinkedIn
This article was developed with AI assistance and edited, fact-checked, and reviewed by the author. See my full AI disclosure.
Sources
- Apple — “Monitor your heart rate with Apple Watch”
Apple Support (US English). Accessed September 21, 2026.
Company documentation.
https://support.apple.com/en-us/120277 - Allen J — “Photoplethysmography and its application in clinical physiological measurement”
Physiological Measurement 28(3):R1, 2007. DOI: 10.1088/0967-3334/28/3/R01
https://doi.org/10.1088/0967-3334/28/3/R01 - Bent B, Goldstein BA, Kibbe WA, Dunn JP — “Investigating sources of inaccuracy in wearable optical heart rate sensors”
npj Digital Medicine 3:18, 2020. DOI: 10.1038/s41746-020-0226-6
https://doi.org/10.1038/s41746-020-0226-6 - Analog Devices (Maxim Integrated) — “Guidelines for the Opto-Mechanical Integration of Heart-Rate Monitors in Wearable Wrist Devices”
Analog Devices application note, March 26, 2019.
Manufacturer documentation.
https://www.analog.com/en/resources/technical-articles/guidelines-for-the-optomechanical-integration-of-heartrate-monitors-in-wearable-wrist-devices.html - Sun X, He H, Xu M, Long Y — “Peripheral perfusion index of pulse oximetry in adult patients: a narrative review”
European Journal of Medical Research 29:457, 2024. DOI: 10.1186/s40001-024-02048-3
https://doi.org/10.1186/s40001-024-02048-3 - Kim KB, Baek HJ — “Photoplethysmography in Wearable Devices: A Comprehensive Review of Technological Advances, Current Challenges, and Future Directions”
Electronics 12(13):2923, 2023. DOI: 10.3390/electronics12132923
https://doi.org/10.3390/electronics12132923 - Lepley AS, et al. — “Consumer Smartwatch Technology in Health and Performance Research: Validity, Limitations, and Real-World Applications”
Sensors 26(14):4486, 2026. DOI: 10.3390/s26144486
https://doi.org/10.3390/s26144486 - Zhang Y, Song S, Vullings R, Biswas D, Simões-Capela N, van Helleputte N, van Hoof C, Groenendaal W — “Motion artifact reduction for wrist-worn photoplethysmograph sensors based on different wavelengths”
Sensors 19(3):673, 2019. DOI: 10.3390/s19030673
https://doi.org/10.3390/s19030673 - Fallow BA, Tarumi T, Tanaka H — “Influence of skin type and wavelength on light wave reflectance”
Journal of Clinical Monitoring and Computing 27:313–317, 2013. DOI: 10.1007/s10877-013-9436-7
https://doi.org/10.1007/s10877-013-9436-7 - Analog Devices — “PPG ID Recommendations for Chest Patch Wearables”
Analog Devices design note (undated).
Manufacturer documentation.
https://www.analog.com/en/resources/design-notes/ppg-id-recommendations–chest-patch-wearables.html - Analog Devices — “Guidelines for the Opto-Mechanical Integration of Heart-Rate Monitors in Wearable Earbud Devices”
Analog Devices application note, August 26, 2019.
Manufacturer documentation.
https://www.analog.com/en/resources/technical-articles/guidelines-for-the-optomechanical-integration-of-heartrate-monitors-in-wearable-earbud-devices.html - Renesas Electronics — “OB1203 Thermal and Optical Design-in Guidelines (X0115552, Rev. 1.1)”
Renesas Electronics, March 3, 2021. Copy hosted by the distributor Avnet.
Manufacturer documentation.
https://www.avnet.com/fsp/opasdata/d120001/medias/docus/204/REN_OB1203-Ther-Optical-Dsgn-Guidelines_MAN_20210303.pdf - Renesas Electronics — “OB1203 Electrical, Thermal, and Optical Design Guide (Application Note R36AN0003EU0100, Rev. 1.00)”
Renesas Electronics, January 12, 2022.
Manufacturer documentation.
https://www.renesas.com/en/document/apn/ob1203-pulse-oximeter-module-electrical-thermal-and-optical-design-guide - Apple — “Wearing your Apple Watch”
Apple Support (US English). Accessed September 21, 2026.
Company documentation.
https://support.apple.com/en-us/118234 - Apple — “Check your heart rate on Apple Watch”
Apple Watch User Guide (watchOS), Apple Support. Accessed September 21, 2026.
Company documentation.
https://support.apple.com/guide/watch/heart-rate-apda88aefe4c/watchos - Apple — “Get the most accurate measurements using your Apple Watch”
Apple Support (US English). Accessed September 21, 2026.
Company documentation.
https://support.apple.com/en-us/105002 - Pham HM, Ho MY, Zhang Y, Spathis D, Saeed A, Ma D — “Reliable wrist PPG monitoring by mitigating poor skin sensor contact”
Scientific Reports 15:45046, 2025. DOI: 10.1038/s41598-025-31883-5
https://doi.org/10.1038/s41598-025-31883-5 - Schäfer A, Vagedes J — “How accurate is pulse rate variability as an estimate of heart rate variability? A review on studies comparing photoplethysmographic technology with an electrocardiogram”
International Journal of Cardiology 166(1):15–29, 2013. DOI: 10.1016/j.ijcard.2012.03.119
https://doi.org/10.1016/j.ijcard.2012.03.119 - Texas Instruments — “AFE4404 Ultra-Small, Integrated AFE for Wearable, Optical, Heart-Rate Monitoring and Bio-Sensing (datasheet SBAS689D, Rev. D)”
Texas Instruments, June 2015, revised December 2016.
Manufacturer documentation.
https://www.ti.com/product/AFE4404 - Analog Devices (Maxim Integrated) — “MAX86140/MAX86141 data sheet (Rev. 5)”
Analog Devices, 2023.
Manufacturer documentation.
https://www.analog.com/media/en/technical-documentation/data-sheets/max86140-max86141.pdf - Ismail S, Akram U, Siddiqi I — “Heart rate tracking in photoplethysmography signals affected by motion artifacts: a review”
EURASIP Journal on Advances in Signal Processing 2021:5, 2021. DOI: 10.1186/s13634-020-00714-2
https://doi.org/10.1186/s13634-020-00714-2 - Apple — “Apple Heart Rate Accuracy Study”
Apple (PDF), September 2026.
Company-authored study; not peer-reviewed.
https://www.apple.com/health/pdf/Heart_Rate_Accuracy_Study_2026.pdf - Zhang Z, Pi Z, Liu B — “TROIKA: A general framework for heart rate monitoring using wrist-type photoplethysmographic signals during intensive physical exercise”
IEEE Transactions on Biomedical Engineering 62(2):522–531, 2015. DOI: 10.1109/TBME.2014.2359372
https://doi.org/10.1109/TBME.2014.2359372 - Colvonen PJ — “Response To: Investigating sources of inaccuracy in wearable optical heart rate sensors”
npj Digital Medicine 4:38, 2021. DOI: 10.1038/s41746-021-00408-5
https://doi.org/10.1038/s41746-021-00408-5 - Bent B, Enache OM, Goldstein B, Kibbe W, Dunn JP — “Reply: Matters Arising ‘Investigating sources of inaccuracy in wearable optical heart rate sensors’”
npj Digital Medicine 4:39, 2021. DOI: 10.1038/s41746-021-00409-4
https://doi.org/10.1038/s41746-021-00409-4 - Koerber D, Khan S, Shamsheri T, et al. — “Accuracy of heart rate measurement with wrist-worn wearable devices in various skin tones: a systematic review”
Journal of Racial and Ethnic Health Disparities 10:2676–2684, 2023. DOI: 10.1007/s40615-022-01446-9
https://doi.org/10.1007/s40615-022-01446-9 - Mulholland AM, MacDonald HV, Aguiar EJ, Wingo JE — “Influence of skin pigmentation on the accuracy and data quality of photoplethysmographic heart rate measurement during exercise”
European Journal of Applied Physiology 126:1057–1066, 2026 (published online September 18, 2025). DOI: 10.1007/s00421-025-05977-x
https://doi.org/10.1007/s00421-025-05977-x - Kostrna J, Oparina E, Palacios C, Rodriguez AJ, Pei J, Ajmal A, Ramella-Roman JC — “PPG-Based Heart Rate Accuracy in Hispanic Adults with Fitzpatrick III–V Skin Tones: An Evaluation of Body Composition and Skin-Tone Effects”
Sensors 26(10):2922, 2026. DOI: 10.3390/s26102922
https://doi.org/10.3390/s26102922 - Bent B, Dunn J — “BigIdeasLab_STEP: Heart rate measurements captured by smartwatches for differing skin tones (version 1.0)”
PhysioNet, 2021.
Dataset record (restricted-access resource).
https://doi.org/10.13026/cqfy-d860 - Lambe R, Baldwin M, O’Grady B, Schumann M, Caulfield B, Doherty C — “The accuracy of Apple Watch measurements: a living systematic review and meta-analysis”
npj Digital Medicine 9:63, 2026. DOI: 10.1038/s41746-025-02238-1
https://doi.org/10.1038/s41746-025-02238-1 - Nguyen Y, Bora V — “Arterial Pressure Monitoring”
StatPearls, StatPearls Publishing (NCBI Bookshelf); last updated March 19, 2023. PMID 32310587.
https://www.ncbi.nlm.nih.gov/books/NBK556127/ - Consumer Technology Association / ANSI — “ANSI/CTA-2065-A-2023, Physical Activity Monitoring for Heart Rate”
ANSI Webstore product page (standard text is paywalled), accessed September 21, 2026.
Standards body.
https://webstore.ansi.org/standards/ansi/ansicta20652023-2589148 - Consumer Technology Association / ANSI — “ANSI/CTA-2065.1-2023, Physical Activity Monitoring for Heart Rate — Real World Analysis”
ANSI Webstore product page (standard text is paywalled), accessed September 21, 2026.
Standards body.
https://webstore.ansi.org/standards/ansi/ansicta20652023 - Reece JD, Bunn JA, Choi M, Navalta JW — “Assessing Heart Rate Using Consumer Technology Association Standards”
Technologies 9(3):46, 2021. DOI: 10.3390/technologies9030046
https://doi.org/10.3390/technologies9030046 - Apple — “Introducing Apple Watch Series 12, with the all-new Health Sensing System”
Apple Newsroom press release, September 9, 2026 (footnote 1).
Company press release.
https://www.apple.com/newsroom/2026/09/introducing-apple-watch-series-12-with-the-all-new-health-sensing-system/